Updated on 30 October 2026. Eurostat’s structural business statistics database, updated on 30 September 2026, contains data for 2024, according to which value added per person employed in Croatia’s business economy was EUR 38,420, or 57.9% of the EU average (EUR 66,400). EU data for medium-sized and large enterprises in 2024 are confidential, so the comparison by size remains for 2023. Eurostat values in the text and charts reflect the databases as of 30 September and 22 October 2026, downloaded on 30 October 2026.
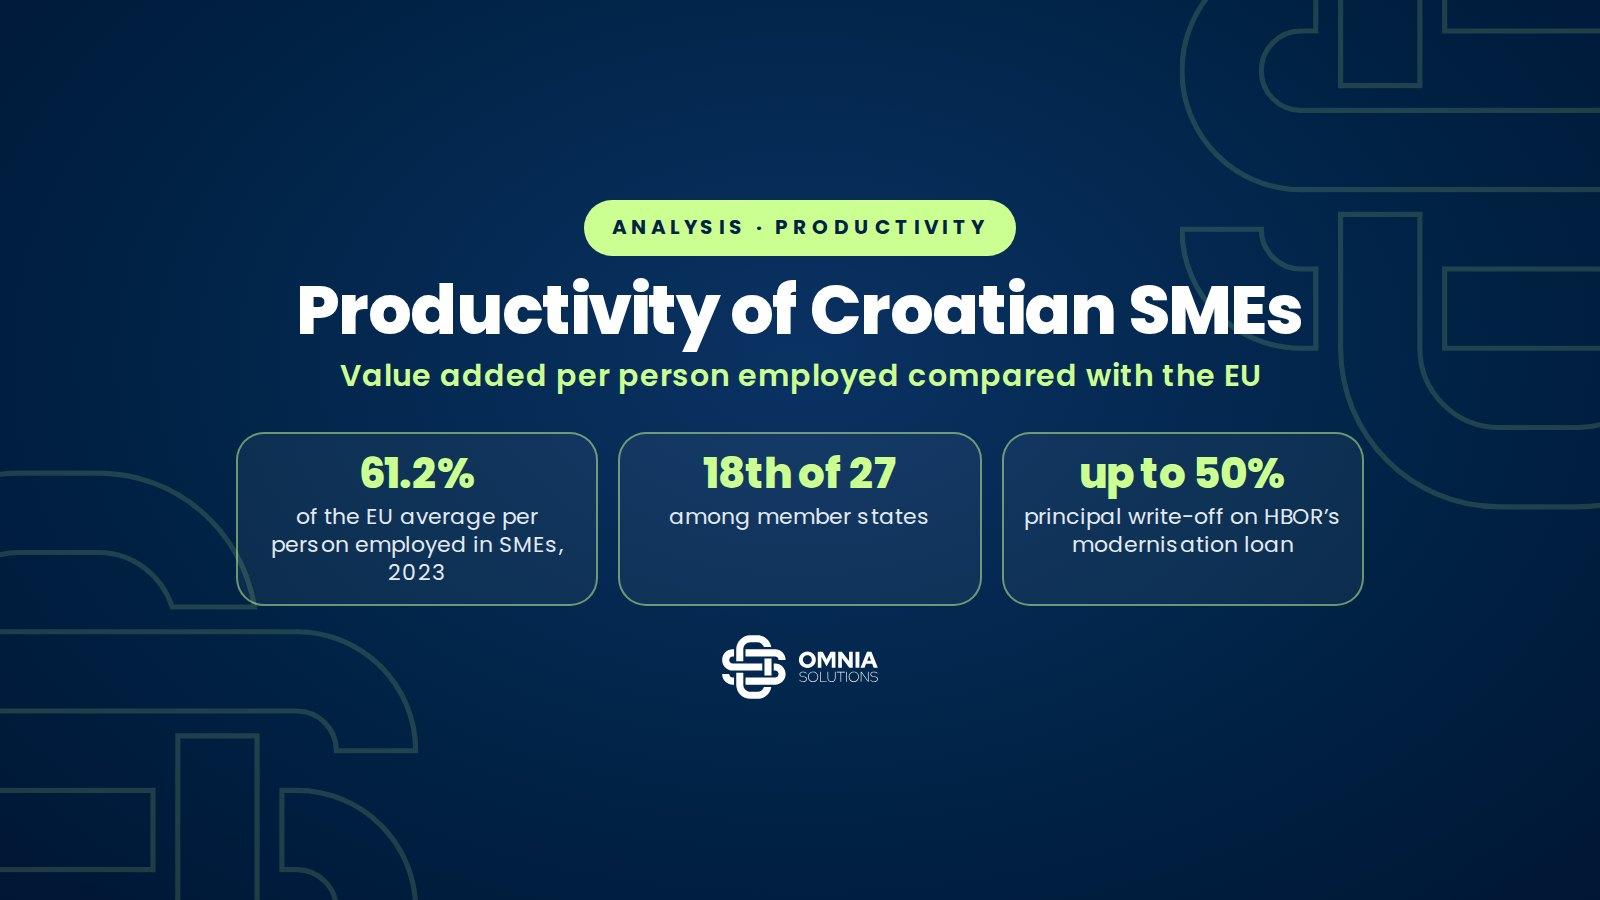
Croatian small and medium-sized enterprises generated EUR 31,640 of value added per person employed in 2023, 61.2% of the EU average of EUR 51,710. That is 18th place among the 27 member states. The gap is smallest for micro enterprises (70.7% of the EU average) and largest for medium-sized and large ones (51.1%), because productivity in Croatia rises much more slowly with firm size than in the EU. In manufacturing Croatia reaches 39.3% of the EU average. HBOR’s production modernisation loan has productivity as its purpose, but its principal write-off does not reward higher value added. It rewards installed Industry 4.0 solutions, digitalisation and alignment with the smart specialisation strategy. Equipment raises value added per person employed only if it increases output or reduces the use of materials and energy.
The analysis draws on Eurostat’s structural business statistics for 2023, the latest year with complete data for all member states and size classes, on national accounts, on the European Commission’s SME Performance Review (June 2026) and on HBOR’s programme. It ends with an example with stated assumptions.
In brief
- Value added per person employed in Croatian SMEs was EUR 31,640 in 2023, against EUR 51,710 in the EU. Croatia ranks 18th of 27, ahead of Portugal, the Baltic states except Estonia, Poland, Slovakia, Hungary, Romania, Bulgaria and Greece.
- The gap widens with firm size. Croatian micro enterprises reach 70.7% of the EU average, firms with 10 to 49 persons employed about 60%, and medium-sized and large ones 51.1%.
- In manufacturing Croatia generates EUR 32,020 per person employed, against EUR 81,420 in the EU (39.3%). Large Croatian manufacturers are at 37.4% of the EU average.
- SMEs generate 63.9% of the value added of Croatia’s business economy, against 50.9% in the EU. The Croatian economy depends more on the productivity of small firms.
- In purchasing power standards, which correct for price differences, Croatia is at 85.8% of the EU average per person employed in 2024 and at 70.5% per hour worked.
- HBOR’s production modernisation loan (EUR 100,000 to 3,000,000, up to 85% of the investment, half at 0% interest) offers a write-off of up to 50% of the principal for Industry 4.0 solutions (10% per solution), digitalisation (2%) and S3 (5%), not for growth in value added.
Sources: 10, listed at the end · How we check our information · Report an error
Key figures
Productivity of Croatian enterprises compared with the EU
Source: Eurostat, structural business statistics, sbs_sc_ovw (2023, database as of 30 September 2026); HBOR, Production Modernisation Loans (15 June 2026). Calculation: Omnia Solutions.
How much value added per person employed do Croatian SMEs generate?
Value added is operating income minus the materials, energy and services a firm buys. It pays the staff, and the remainder is the gross operating surplus. Divided by persons employed, including working owners, it is the most common measure of labour productivity in enterprises, published by Eurostat for industry, construction and market services.
In 2023 Croatia’s business economy generated value added of EUR 46.25 billion with 1,310,039 persons employed, or EUR 35,300 per person, 54.7% of the EU average of EUR 64,510. Small and medium-sized enterprises generated EUR 29.55 billion with 934,040 persons employed, or EUR 31,640 per person, against EUR 51,710 in the EU. The European Commission’s June 2026 estimate for 2025 also comes to 61.2% of the EU average, with Croatian SMEs generating EUR 33.4 billion with 986,475 persons employed, or EUR 33,860 per person, against EUR 55,360 in the EU.
SMEs carry a larger part of the economy in Croatia than in the EU. They generate 63.9% of value added and employ 71.3% of people in the business economy, against 50.9% and 63.5% in the EU. That makes the productivity of small firms a central issue for Croatia.
Interactive chart
Value added per person employed by enterprise size, 2023 (thousand euro)
Micro (0–9)
10–19 persons
20–49 persons
Medium (50–249)
Large (250+)
Total
Micro (0–9)
10–19 persons
20–49 persons
Medium (50–249)
Large (250+)
Total
Croatian micro enterprises reach 70.7% of the EU average, medium-sized and large ones 51.1%. In Croatia productivity rises by 16.3% from micro to medium-sized enterprises, in the EU by 61.0%.
Source: Eurostat, structural business statistics, sbs_sc_ovw (2023, database as of 30 September 2026). Business economy = industry, construction and market services (B to S excluding public administration and membership organisations). Thousand euro per person employed, current prices.
Why does the gap widen with firm size?
In the EU productivity rises with firm size. A micro enterprise generates EUR 42,090 per person employed, a medium-sized one EUR 67,760, 61.0% more, and a large one EUR 86,810, more than double. In Croatia that rise is shallow. A micro enterprise generates EUR 29,770, a medium-sized one EUR 34,610, only 16.3% more, and a large one EUR 44,400. As a result Croatian micro enterprises reach 70.7% of the EU average, but medium-sized and large ones only 51.1%.
In manufacturing, the target of HBOR’s modernisation loan, the disparity is even larger. Croatian manufacturers generate EUR 32,020 per person employed, European ones EUR 81,420. Manufacturers with 20 to 49 persons employed generate EUR 28,720 against EUR 54,170 in the EU (53.0%), medium-sized ones EUR 31,260 against EUR 67,380 (46.4%), and large ones EUR 40,860 against EUR 109,190 (37.4%).
The data do not show the cause, but the pattern is consistent with lower capital and technology intensity and a different mix of activities. In its annual report on European SMEs 2025/2026 the European Commission notes that size alone does not determine productivity, because technology, sector and location can offset it.
Where do Croatian SMEs stand among EU member states?
With EUR 31,640 of value added per person employed, Croatian SMEs rank 18th of 27. Slovenia (EUR 45,390), Estonia (38,550) and Czechia (36,160) are ahead, and Portugal (29,330), Latvia, Poland, Lithuania, Slovakia, Hungary (25,040), Romania, Bulgaria and Greece (20,540) are behind. Luxembourg (EUR 134,850), Ireland (106,680), Belgium (87,280) and the Netherlands (74,360) lead. Croatian micro enterprises rank 17th and Croatia’s business economy as a whole 20th.
Large enterprises rank lowest. With EUR 44,400 per person employed Croatia is 25th, with only Romania and Bulgaria behind. Large enterprises generate EUR 61,660 in Slovakia, EUR 58,630 in Poland and EUR 53,850 in Hungary, even though SMEs in those countries are less productive than Croatian ones. Croatia’s gap is therefore largest precisely among large enterprises.
Interactive chart
EU member states: value added per person employed, 2023 (thousand euro)
Luxembourg
Ireland
Belgium
Netherlands
Denmark
Sweden
Finland
Austria
Germany
France
Italy
Malta
EU-27 average
Cyprus
Spain
Slovenia
Estonia
Czechia
Croatia
Portugal
Latvia
Poland
Lithuania
Slovakia
Hungary
Romania
Bulgaria
Greece
SMEs are enterprises with fewer than 250 persons employed. With EUR 31.64 thousand Croatia ranks 18th of 27, ahead of Portugal, Latvia, Poland, Lithuania, Slovakia, Hungary, Romania, Bulgaria and Greece.
Show the data in a table
| Country | SMEs (0–249) | Micro enterprises (0–9) | Large (250+) | Total |
|---|---|---|---|---|
| Luxembourg | 134.85 | 116.92 | 163.06 | 145.61 |
| Ireland | 106.68 | 137.53 | 359.39 | 190.44 |
| Belgium | 87.28 | 75.53 | 107.43 | 95.15 |
| Netherlands | 74.36 | 64.97 | 89.21 | 80.33 |
| Denmark | 72.26 | 64.34 | 125.08 | 91.41 |
| Sweden | 70.81 | 52.30 | 104.65 | 85.29 |
| Finland | 67.93 | 62.24 | 89.60 | 75.80 |
| Austria | 66.60 | 49.52 | 100.10 | 78.28 |
| Germany | 62.09 | 57.92 | 89.91 | 74.54 |
| France | 59.80 | 53.70 | 88.66 | 73.12 |
| Italy | 52.23 | 38.83 | 95.50 | 63.22 |
| Malta | 51.93 | 43.06 | 81.26 | 58.21 |
| EU-27 average | 51.71 | 42.09 | 86.81 | 64.51 |
| Cyprus | 47.42 | 31.38 | 68.23 | 51.29 |
| Spain | 46.36 | 38.45 | 70.48 | 54.74 |
| Slovenia | 45.39 | 33.65 | 70.32 | 51.94 |
| Estonia | 38.55 | 29.82 | 54.44 | 41.46 |
| Czechia | 36.16 | 28.34 | 63.93 | 44.77 |
| Croatia | 31.64 | 29.77 | 44.40 | 35.30 |
| Portugal | 29.33 | 20.12 | 53.52 | 34.87 |
| Latvia | 28.49 | 21.43 | 45.04 | 32.39 |
| Poland | 27.75 | 20.40 | 58.63 | 37.94 |
| Lithuania | 27.58 | 16.45 | 46.24 | 32.57 |
| Slovakia | 27.03 | 17.20 | 61.66 | 36.16 |
| Hungary | 25.04 | 17.03 | 53.85 | 33.27 |
| Romania | 23.88 | 18.62 | 41.84 | 29.67 |
| Bulgaria | 22.03 | 18.67 | 37.58 | 26.08 |
| Greece | 20.54 | 14.10 | 71.68 | 29.25 |
Source: Eurostat, structural business statistics, sbs_sc_ovw (2023, database as of 30 September 2026). The SME value is calculated as the value added of all enterprises minus large ones, divided by persons employed excluding large ones. Calculation and ranking: Omnia Solutions.
How has productivity changed since 2013?
Structural business statistics are expressed in euro at current prices, so differences in price levels widen the gap. Eurostat’s national accounts also give productivity in purchasing power standards, which correct for those differences, for the whole economy. On that measure Croatia was at 76.6% of the EU average per person employed in 2013, 80.2% in 2019, 88.8% in 2023 and 85.8% in 2024. The provisional figure for 2025 is 85.6%. Convergence is therefore real, nine percentage points in eleven years.
Per hour worked the picture is weaker. Croatia was at 70.5% of the EU average in 2024, because people employed in Croatia work about 22% more hours than the EU average, 1,961.6 hours a year, and the provisional figure for 2025 is 70.4%. Per person employed, Slovenia is at 86.0% in 2025, Poland, which was behind Croatia in 2013, at 84.8%, and Hungary at 73.8%. Per hour worked, Slovenia is at 86.1% in 2025, Hungary at 70.6% and Poland at 68.4%. On that measure Croatia is ahead of Poland, almost level with Hungary and far behind Slovenia.
Interactive chart
Labour productivity in purchasing power standards, EU-27 = 100
Show the data in a table
| Year | Croatia, per person employed | Croatia, per hour worked | Slovenia, per person employed | Poland, per person employed |
|---|---|---|---|---|
| 2013 | 76.6 | 61.6 | 79.8 | 72.9 |
| 2014 | 73.2 | 59.1 | 80.3 | 73.0 |
| 2015 | 73.4 | 60.5 | 79.4 | 74.4 |
| 2016 | 75.7 | 62.0 | 79.6 | 73.9 |
| 2017 | 77.0 | 62.1 | 80.4 | 74.8 |
| 2018 | 78.5 | 63.6 | 80.8 | 77.1 |
| 2019 | 80.2 | 65.0 | 81.7 | 78.3 |
| 2020 | 77.3 | 59.7 | 82.2 | 80.4 |
| 2021 | 82.5 | 66.4 | 83.3 | 79.4 |
| 2022 | 83.1 | 67.9 | 83.8 | 80.6 |
| 2023 | 88.8 | 72.1 | 85.3 | 79.7 |
| 2024 | 85.8 | 70.5 | 84.4 | 82.1 |
| 2025 | 85.6 | 70.4 | 86.0 | 84.8 |
Whole economy, nominal productivity in purchasing power standards (PPS), which correct for differences in price levels. Solid lines show productivity per person employed (Croatia, Slovenia, Poland), the dashed line Croatia’s productivity per hour worked. Per hour worked Slovenia is at 86.1% in 2025 and Poland at 68.4%. Values for 2025 are provisional. Hover over or tap the chart.
Source: Eurostat, nama_10_lp_ulc (database as of 22 October 2026).
What does equipment financing really change?
Value added is calculated as operating income minus purchases of goods and services. Interest and depreciation are not part of that calculation, so a cheaper or more expensive loan changes profit, not value added per person employed. New equipment raises that measure in two ways, higher output with the same staff or lower use of materials, energy and external services per unit of output. If the firm hires proportionally more people along with the equipment, value added per person employed stays the same.
HBOR’s Production Modernisation Loans programme, in its version of 15 June 2026, is intended for micro, small and medium-sized manufacturers, and its purpose is to promote productivity and competitiveness. The loan ranges from EUR 100,000 to EUR 3,000,000, as a rule up to 85% of the investment, with a term of up to 15 years and a grace period of up to three years. Half of the loan is financed by the European Regional Development Fund at 0% interest and half by HBOR at a fixed rate based on risk assessment. Up to 30% of the loan can go to working capital.
The capital rebate, a write-off of up to 50% of the disbursed principal, is tied to three criteria in Annex 2 of the programme. Each Industry 4.0 solution (automation, robotics, sensors, AI-controlled machines) earns 10%, provided it costs at least 10% of the loan principal. Each solution for digitalising business processes, such as ERP or CRM, earns 2%, and aligning the result with the Smart Specialisation Strategy earns 5%. A permanent court expert confirms fulfilment. Productivity and value added per person employed are not criteria. The write-off rewards the type of technology, while the effect on value added depends on how the equipment is used.
According to HBOR data published by Lider in September 2025, 85 applications worth almost EUR 100 million had been received, almost 60% of the planned funds, and 15 loans totalling EUR 13.52 million had been approved. An example from our practice is PG Orehovec, a poultry producer and processor from Veliki Bukovec, which, with an investment of almost EUR 2 million and an HBOR loan of about EUR 1.45 million, obtained a principal write-off of approximately EUR 730,000, or 50%. The investment covered automated cutting, weighing, filleting and packaging, and real-time tracking of production and stock linked to the ERP system.
The example below shows the order of magnitude. A manufacturer with 25 employees and value added of EUR 28,720 per person employed, the Croatian average for manufacturers of that size, invests EUR 1 million in equipment. If output rises by 15% with the same staff and the share of materials and services in revenue stays the same, value added per person employed rises to EUR 33,028. That is EUR 4,308 more, but still far from the European EUR 54,170. The 15% growth assumption is an illustration, not an average or a forecast.
Example with assumptions
How an equipment investment changes value added per person employed
Illustration, not an average or forecast. Assumptions: Omnia Solutions. Starting values: Eurostat, sbs_sc_ovw (manufacturing, 20 to 49 persons employed, 2023); loan terms: HBOR, Production Modernisation Loans.
What this means for businesses
- Before investing, calculate your own value added per person employed and compare it with the Croatian and European average for the same size and activity. This shows how much room for growth there is and how much of it equipment can realistically cover.
- Conditions, deadlines and documents for the HBOR production modernisation loan are described in our guide. How the principal write-off is calculated and proven is explained in our article on the capital rebate, and the instalments and total cost of an HBOR loan versus a bank loan can be checked in the HBOR loan calculator.
- Industry 4.0 solutions bring the largest part of the write-off, but each must cost at least 10% of the principal. The differences between Industry 4.0, 5.0 and 6.0 and data on their use in Croatia are in our article on Industry 4.0, 5.0 and 6.0.
- What the whole process looks like in practice, from the digital transformation plan to the court expert’s confirmation, is described in the case of PG Orehovec and its 50% principal write-off. Other HBOR programmes are covered in our guide to HBOR loans for entrepreneurs 2026.
- For firms aiming at a new production method rather than replacing equipment, grant calls for process innovation in S3 areas may be a better fit. How much Croatia invests in research and development is covered in our analysis of R&D spending.
Methodology: value added per person employed is Eurostat’s apparent labour productivity indicator (value added at factor cost divided by persons employed) from the dataset sbs_sc_ovw for the business economy (industry, construction and market services excluding public administration and membership organisations) and for manufacturing, in current euro, for 2023. SME values were calculated from value added and persons employed for all enterprises and for large enterprises. For the trend over time we used national accounts (nama_10_lp_ulc, nominal productivity per person employed and per hour worked in purchasing power standards), because Croatia’s structural business statistics series shows an unusually large jump in 2023. Estimates for 2025 come from the Croatia and EU profiles in the SME Performance Review 2026. Loan terms and write-off criteria come from HBOR’s programme of 15 June 2026 and its Annex 2. The equipment example is an illustration with stated assumptions.
Frequently asked questions
What is value added per person employed in Croatian SMEs?
According to Eurostat, EUR 31,640 per person employed in 2023, 61.2% of the EU average of EUR 51,710. Micro enterprises generate EUR 29,770 and medium-sized ones EUR 34,610. The European Commission estimates EUR 33,860 for 2025, also 61.2% of the EU average.
Where does Croatia rank in the EU on SME productivity?
Croatia ranks 18th of 27. Portugal, Latvia, Poland, Lithuania, Slovakia, Hungary, Romania, Bulgaria and Greece are behind it. On the productivity of large enterprises Croatia ranks 25th, with only Romania and Bulgaria behind.
Why is the gap larger for bigger firms?
In the EU a medium-sized enterprise generates 61.0% more value added per person employed than a micro enterprise, in Croatia only 16.3% more. Larger Croatian firms generate only slightly more per person than smaller ones, which is consistent with lower capital intensity and a different mix of activities.
Is productivity a condition for the principal write-off on HBOR’s modernisation loan?
No. The write-off of up to 50% of the principal is granted for Industry 4.0 solutions (10% per solution costing at least 10% of the principal), digital solutions (2% per solution) and alignment with the Smart Specialisation Strategy (5%). A permanent court expert confirms fulfilment after implementation.
How does new equipment change value added per person employed?
Only if it increases output or reduces the use of materials, energy and services with the same staff. Interest and depreciation are not part of value added, so loan terms affect profit, not this measure. In our example 15% higher output raises value added per person employed from EUR 28,720 to EUR 33,028.
Who can get HBOR’s production modernisation loan?
Micro, small and medium-sized enterprises registered in manufacturing with a business unit in Croatia. The loan ranges from EUR 100,000 to EUR 3,000,000, as a rule up to 85% of the investment, with a term of up to 15 years. Half of the loan carries 0% interest from the European Regional Development Fund.

About the author
Matija Vlahovski, MSc in Economics
Co-founder and director of Omnia Solutions. He has more than ten years of experience in business financing, mostly with HAMAG-BICRO loans, HBOR loans, investment studies and tax incentives. He has taken part in more than 90 projects, through which clients were awarded more than EUR 12 million in grants and more than EUR 2 million in tax incentives. Before consulting, he worked at Privredna banka Zagreb, preparing loan proposals for small and medium-sized enterprises. He holds a HANFA licence.
Sources
- Eurostat, sbs_sc_ovw, structural business statistics by size class (2023)
- Eurostat, nama_10_lp_ulc, labour productivity and unit labour costs
- Eurostat, glossary, value added at factor cost
- European Commission, SME Performance Review, Croatia SME Fact Sheet 2026
- European Commission, SME Performance Review, EU27 SME Fact Sheet 2026
- European Commission, SME Performance Review and Annual Report on European SMEs 2025/2026 (22 June 2026)
- HBOR, Production Modernisation Loans programme (15 June 2026, in Croatian)
- HBOR, Schedule 2, criteria for the capital discount
- Lider, HBOR data on modernisation loan applications (12 September 2025)
- Omnia Solutions, HBOR production modernisation loan and a 50% principal write-off for PG Orehovec (6 May 2026)
Planning an equipment investment?
Let us check how large a principal write-off your investment can achieve
We will review your investment plan, the criteria for HBOR’s capital rebate and the expected effect on output, and propose the most favourable financing model. Omnia does not finance investments or decide on approval, and the introductory call is free.