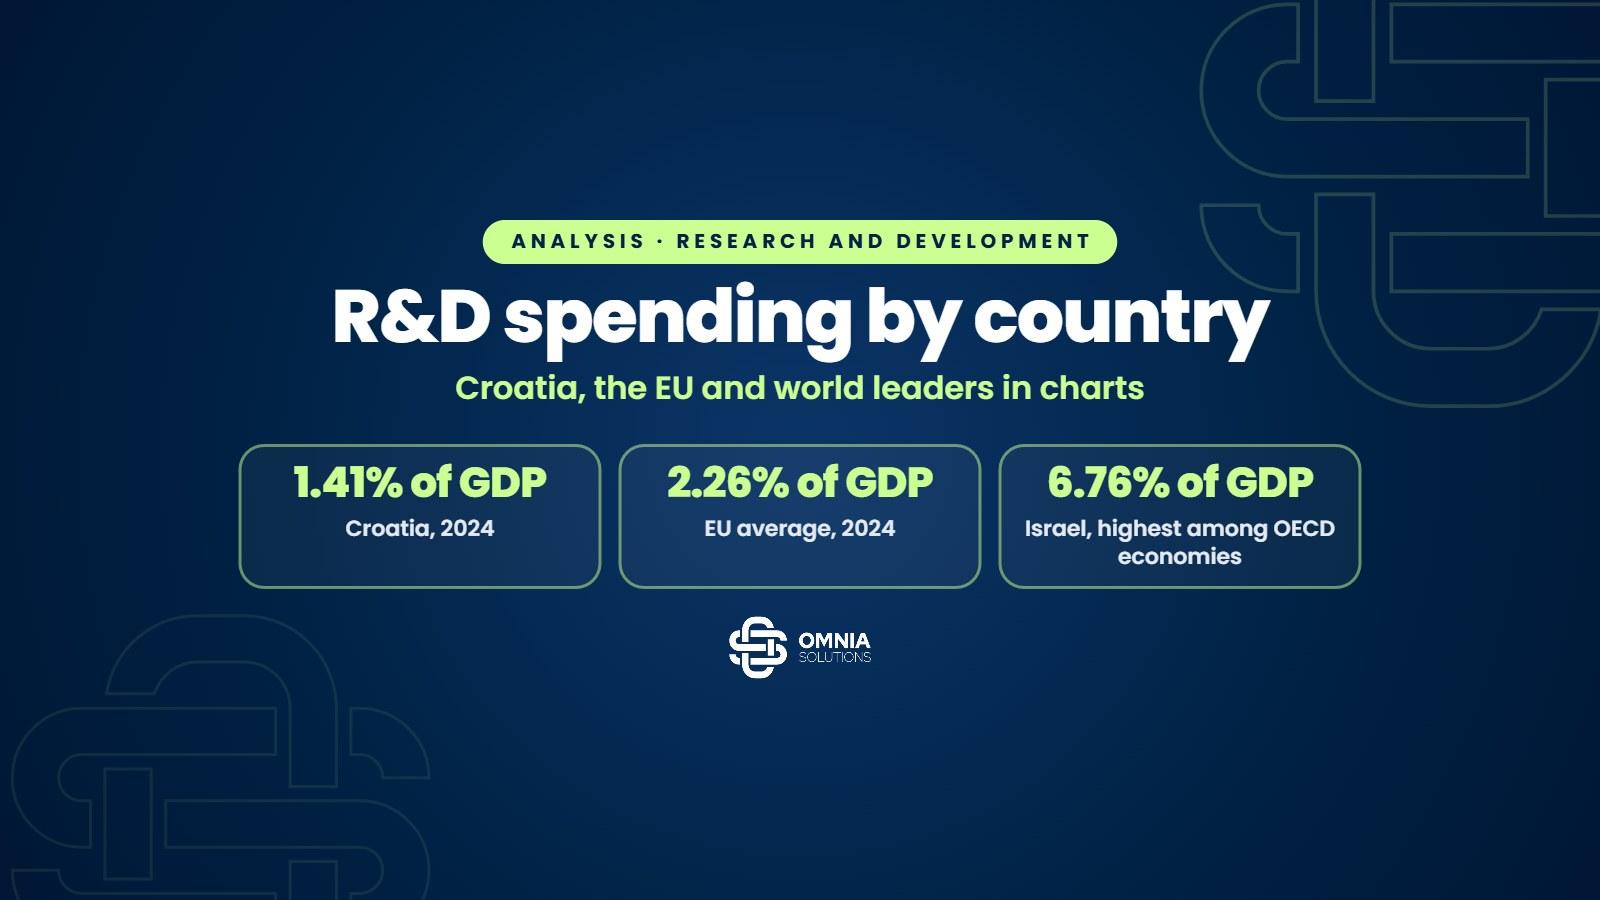
In 2024 Croatia invested EUR 1.21 billion in research and development (R&D), or 1.41% of gross domestic product (GDP). The European Union average is 2.26%, and the target of both the EU and Croatia’s National Development Strategy to 2030 is 3% of GDP. The world leaders are Israel (6.76%), South Korea (5.13%) and Taiwan (4.10%), and within the EU Sweden (3.53%). Richer economies generally invest more. Across 113 economies, the correlation coefficient between R&D expenditure as a share of GDP and GDP per capita is 0.50.
This analysis uses official data from Eurostat, the OECD, the World Bank and the Croatian Bureau of Statistics (DZS), with five interactive charts, key figures, a correlation analysis with GDP per capita and a calculator of the investment needed to reach the EU average. It ends with an overview of the support that businesses in Croatia can use for their own R&D.
Key points
- Croatia invests 1.41% of GDP in R&D and shares 16th place in the EU with Italy. Per inhabitant this is EUR 313, against EUR 909 in the EU.
- Since 2014 the share has risen from 0.77% to 1.41% of GDP, and spending from EUR 340 million to EUR 1.21 billion. According to current Eurostat data, this is the third largest increase in the EU in percentage points.
- The largest gap is in the business sector, which performs R&D worth 0.80% of GDP, against 1.50% in the EU.
- According to Eurostat, since 2020 China has invested a larger share of GDP than the EU; in 2024 the shares were 2.69% and 2.26%.
- The link with GDP per capita is moderate and positive, but it does not prove causation and weakens markedly among high-income economies. Croatia is close to the global trend line.
- To reach the EU average, Croatia would need to invest about EUR 0.8 billion more per year, and about EUR 1.5 billion more for the 3% target.
Key figures
Investment in research and development in 2024
Sources: Eurostat (updated 29 September 2026), OECD MSTI (March 2026).
How much does Croatia invest in R&D?
According to Eurostat, gross domestic expenditure on R&D in Croatia amounted to EUR 1,208.8 million in 2024, 11.7% more than in 2023. The share of GDP was 1.41%, the same as in Italy, which places Croatia 16th among the 27 Member States. DZS published the same share in July 2026.
Spending in euros has risen every year since 2014. That year Croatia invested 0.77% of GDP in R&D, and by 2024 the share had risen by 0.64 percentage points. According to current Eurostat data, only Belgium and Greece recorded larger increases in percentage points. Over the same period the EU average rose from 2.09% to 2.26%, so the gap narrowed from 1.32 to 0.85 percentage points.
Per inhabitant, Croatia invests EUR 313 a year, about one third of the EU average of EUR 909. The gap is wider than for the share of GDP because GDP per capita in euros is only about 56% of the EU average (78.5% in purchasing power standards).
Interactive chart
R&D expenditure 2014–2024, % of GDP
Show the data as a table
| Year | Croatia | EU average | Slovenia |
|---|---|---|---|
| 2014 | 0.77% | 2.09% | 2.39% |
| 2015 | 0.82% | 2.10% | 2.22% |
| 2016 | 0.85% | 2.10% | 2.03% |
| 2017 | 0.84% | 2.14% | 1.88% |
| 2018 | 0.95% | 2.17% | 1.96% |
| 2019 | 1.08% | 2.21% | 2.06% |
| 2020 | 1.24% | 2.28% | 2.16% |
| 2021 | 1.24% | 2.24% | 2.14% |
| 2022 | 1.42% | 2.22% | 2.10% |
| 2023 | 1.37% | 2.25% | 2.13% |
| 2024 | 1.41% | 2.26% | 2.14% |
Hover over or tap the chart to see the values for each year.
Source: Eurostat, rd_e_gerdtot (updated 29 September 2026).
World leaders in R&D spending
According to the OECD Main Science and Technology Indicators (MSTI), Israel (6.76% in 2024), South Korea (5.13%) and Taiwan (4.10%) invest the largest shares of GDP in R&D. They are followed by Japan (3.62%, OECD estimate), Sweden (3.56%; 3.53% according to Eurostat) and the United States (3.44%). The OECD average is 2.72%, and the world average according to UNESCO and World Bank data is about 2.6% (2023).
South Korea raised its share from 3.89% to 5.13% of GDP in ten years. According to data published by Eurostat, in 2020 China invested a larger share of GDP than the EU for the first time (2.36% against 2.28%), and in 2024 the shares were 2.69% and 2.26%. The EU as a whole lags behind the United States, Japan and China, although six Member States, Sweden, Austria, Belgium, Finland, Denmark and Germany, exceed the 3% target.
Interactive chart
World leaders: R&D expenditure as % of GDP
Israel
South Korea
Taiwan
Japan *
Sweden
United States
Austria
Belgium
Finland
Denmark
Germany
Switzerland (2023)
United Kingdom (2023)
OECD average
China
World average (2023)
EU average
Slovenia
Singapore (2023)
Canada
Croatia
Selected economies. Hover over or tap a bar for details. The year is 2024 unless stated otherwise. * OECD estimate. For the United States and Israel the OECD notes methodological differences from other countries.
Sources: OECD Main Science and Technology Indicators (non-EU countries and OECD average), Eurostat (EU Member States and EU average), World Bank and UNESCO (world average, 2023).
Where does Croatia stand in the EU?
With 1.41%, Croatia is just below the middle of the ranking, ahead of Poland (1.40%), Hungary (1.31%) and Slovakia (0.98%), and behind Slovenia (2.14%), Estonia (1.98%), Czechia (1.82%) and Portugal (1.73%). The lowest shares are in Romania (0.46%), Malta (0.61%) and Cyprus (0.64%).
The comparison with Estonia shows the room for growth. Both countries have almost the same GDP per capita (78.6% and 78.5% of the EU average in purchasing power standards), yet Estonia invests 1.98% of GDP in R&D, 0.57 percentage points more than Croatia. Portugal, with GDP per capita at 82.3% of the EU average, invests 1.73%.
The chart compares three indicators: total R&D expenditure as a share of GDP, R&D performed by businesses, and spending in euros per inhabitant.
Interactive chart
EU Member States: R&D expenditure in 2024
Sweden
Austria
Belgium
Finland
Denmark
Germany
Netherlands
EU average
France
Slovenia
Estonia
Czechia
Portugal
Ireland
Greece
Spain
Croatia
Italy
Poland
Hungary
Lithuania
Luxembourg
Slovakia
Latvia
Bulgaria
Cyprus
Malta
Romania
With 1.41% Croatia shares 16th place with Italy. Six Member States meet or exceed the 3% target.
Source: Eurostat, rd_e_gerdtot (updated 29 September 2026). Business = R&D performed by the business enterprise sector.
Who performs and funds R&D in Croatia?
Most of the gap with the EU is in the business sector. In 2024 businesses in Croatia performed R&D worth 0.80% of GDP, against 1.50% in the EU. Of the total gap of 0.85 percentage points, 0.70 points are in the business sector. Higher education (0.37% against 0.49%) and government (0.24% against 0.25%) are closer to the EU average.
Business R&D is growing faster than the total. Between 2014 and 2024 it rose from EUR 164 million to EUR 686 million, and from 0.37% to 0.80% of GDP. Businesses now perform 57% of all R&D in Croatia, against about two thirds in the EU.
Funding shows a similar picture. In 2023 businesses in Croatia funded 45.1% of total R&D, against 56.7% in the EU. Government funded 33.4% (EU 30.1%) and sources abroad 18.3% (EU 10.9%), of which the European Commission 10.9% (EU 2.6%). Croatian R&D therefore depends more on European programmes than R&D in the EU as a whole. In 2024 businesses funded 45.6% of total R&D and the European Commission 6.7%.
Interactive chart
Who performs and who funds R&D: Croatia and the EU
Business
Higher education
Government
Private non-profit
Business
Government
Abroad (including the EU)
Higher education
Private non-profit
Of the 0.85 percentage point gap between Croatia and the EU, 0.70 points are in the business sector.
Source: Eurostat, rd_e_gerdtot and rd_e_gerdfund (updated 29 September 2026). Funding is shown for 2023, the latest year with EU data.
Is higher R&D spending linked to higher GDP per capita?
Yes, moderately. Using World Bank and UNESCO data for 113 economies and the latest available year (mostly 2023 and 2024), the correlation coefficient between R&D expenditure as a share of GDP and GDP per capita at purchasing power parity is 0.50. With the logarithm of GDP per capita it is 0.53, and the rank (Spearman) coefficient is 0.67. The logarithm of GDP per capita accounts statistically for about 28% of the variation in R&D spending (R² = 0.28), which does not imply causation.
The difference is clear across groups. In the quarter of economies with the lowest GDP per capita (up to about USD 14,700) the median R&D expenditure is 0.16% of GDP, and in the quarter with the highest (above about USD 58,000) it is 1.81%.
There are many exceptions, however. Among the 55 high-income economies the coefficient falls to 0.11, and the rank coefficient to 0.34. Qatar, Macao and Luxembourg have a very high GDP per capita but invest less than 1.1% of GDP, while Israel and South Korea invest far more than their income would suggest. In the EU, the correlation across all 27 Member States is only 0.16, because the GDP per capita of Ireland and Luxembourg largely reflects the profits of multinational companies and the work of cross-border commuters. Without these two countries the coefficient is 0.68.
Correlation does not prove causation. Richer economies can afford more research, and R&D raises productivity over time, so the link probably runs both ways and depends on the structure of the economy. Croatia is close to the global trend line. For its GDP per capita the trend predicts about 1.35% of GDP, and according to the same source Croatia invested 1.39% in 2023 (1.37% according to Eurostat). Within the EU, excluding Ireland and Luxembourg, the trend line predicts about 1.32% at Croatia's GDP per capita and about 2.05% at the EU average, so much of the gap mirrors the gap in income. Estonia and Portugal show that countries with a similar income can invest more.
Interactive chart
R&D expenditure and GDP per capita
Each dot is one economy, latest available year from 2019 to 2024. Hover over or tap a dot. The dashed line shows the trend (regression on the logarithm of GDP per capita). World Bank and UNESCO values may differ from Eurostat and OECD figures.
World data as a table (113 economies)
| Economy | R&D, % of GDP | GDP per capita (USD PPP) | Year |
|---|---|---|---|
| Israel | 6.35% | 55,301 | 2023 |
| South Korea | 4.94% | 57,430 | 2023 |
| Sweden | 3.60% | 68,458 | 2023 |
| United States | 3.45% | 82,587 | 2023 |
| Japan | 3.44% | 52,726 | 2023 |
| Belgium | 3.27% | 72,630 | 2023 |
| Austria | 3.25% | 74,261 | 2023 |
| Switzerland | 3.22% | 93,940 | 2023 |
| Germany | 3.15% | 72,262 | 2023 |
| Finland | 3.09% | 63,467 | 2023 |
| Denmark | 3.05% | 77,425 | 2023 |
| United Kingdom | 2.68% | 60,787 | 2023 |
| Iceland | 2.64% | 82,257 | 2023 |
| China | 2.58% | 25,200 | 2023 |
| Netherlands | 2.27% | 80,392 | 2023 |
| France | 2.18% | 60,927 | 2023 |
| Slovenia | 2.13% | 56,151 | 2023 |
| Australia | 1.86% | 58,327 | 2021 |
| Norway | 1.85% | 107,768 | 2023 |
| Estonia | 1.84% | 48,848 | 2023 |
| Czechia | 1.83% | 56,062 | 2023 |
| Singapore | 1.81% | 144,418 | 2022 |
| Canada | 1.79% | 65,483 | 2024 |
| Portugal | 1.70% | 49,800 | 2023 |
| Ireland | 1.59% | 133,440 | 2023 |
| Poland | 1.55% | 48,473 | 2023 |
| New Zealand | 1.55% | 54,950 | 2023 |
| United Arab Emirates | 1.50% | 68,580 | 2021 |
| Greece | 1.49% | 42,614 | 2023 |
| Spain | 1.49% | 55,661 | 2023 |
| Türkiye | 1.42% | 43,196 | 2023 |
| Croatia | 1.39% | 47,760 | 2023 |
| Italy | 1.38% | 60,350 | 2023 |
| Hungary | 1.38% | 46,376 | 2023 |
| Brazil | 1.19% | 21,193 | 2023 |
| Hong Kong | 1.13% | 75,342 | 2024 |
| Luxembourg | 1.07% | 152,596 | 2023 |
| Lithuania | 1.05% | 52,720 | 2023 |
| Slovakia | 1.03% | 45,865 | 2023 |
| Egypt | 1.02% | 19,122 | 2024 |
| Malaysia | 1.01% | 34,414 | 2022 |
| Serbia | 0.94% | 32,832 | 2024 |
| Russia | 0.94% | 47,686 | 2024 |
| Thailand | 0.94% | 23,598 | 2023 |
| Latvia | 0.82% | 42,784 | 2023 |
| Kenya | 0.81% | 6,650 | 2024 |
| Bulgaria | 0.79% | 38,829 | 2023 |
| Rwanda | 0.78% | 3,519 | 2023 |
| Tunisia | 0.75% | 12,495 | 2019 |
| Iran | 0.73% | 15,884 | 2021 |
| Uruguay | 0.70% | 34,546 | 2023 |
| Cyprus | 0.68% | 59,875 | 2023 |
| Qatar | 0.68% | 116,833 | 2021 |
| Malta | 0.65% | 67,101 | 2023 |
| India | 0.65% | 6,766 | 2020 |
| Namibia | 0.65% | 10,661 | 2022 |
| Saudi Arabia | 0.64% | 71,936 | 2024 |
| South Africa | 0.61% | 14,747 | 2022 |
| Argentina | 0.60% | 30,246 | 2023 |
| Belarus | 0.59% | 33,166 | 2024 |
| Romania | 0.52% | 45,982 | 2023 |
| Algeria | 0.44% | 17,646 | 2024 |
| Uganda | 0.44% | 3,100 | 2023 |
| Vietnam | 0.41% | 15,034 | 2023 |
| Chile | 0.39% | 30,919 | 2022 |
| Oman | 0.39% | 41,801 | 2024 |
| Republic of the Congo | 0.38% | 6,646 | 2022 |
| North Macedonia | 0.37% | 26,996 | 2024 |
| Ukraine | 0.37% | 18,636 | 2024 |
| Montenegro | 0.36% | 23,705 | 2019 |
| Costa Rica | 0.34% | 29,248 | 2023 |
| Macao | 0.31% | 127,144 | 2024 |
| Colombia | 0.29% | 15,519 | 2020 |
| Armenia | 0.29% | 22,856 | 2024 |
| Nigeria | 0.28% | 7,551 | 2019 |
| Indonesia | 0.28% | 11,729 | 2020 |
| Philippines | 0.28% | 8,238 | 2020 |
| Georgia | 0.26% | 27,487 | 2024 |
| Mauritius | 0.26% | 31,697 | 2024 |
| Mexico | 0.25% | 25,820 | 2024 |
| Bermuda | 0.23% | 85,146 | 2020 |
| Togo | 0.22% | 3,815 | 2024 |
| Moldova | 0.22% | 18,662 | 2024 |
| Bosnia and Herzegovina | 0.21% | 25,148 | 2024 |
| Azerbaijan | 0.21% | 25,146 | 2024 |
| Albania | 0.20% | 22,138 | 2022 |
| Panama | 0.20% | 41,430 | 2024 |
| Bahrain | 0.19% | 67,230 | 2024 |
| Malawi | 0.18% | 1,450 | 2019 |
| Peru | 0.18% | 17,042 | 2023 |
| Pakistan | 0.16% | 6,019 | 2023 |
| Kazakhstan | 0.16% | 40,950 | 2024 |
| Andorra | 0.16% | 68,459 | 2022 |
| Mali | 0.15% | 3,178 | 2023 |
| Paraguay | 0.14% | 17,585 | 2023 |
| Burkina Faso | 0.10% | 2,901 | 2024 |
| Sri Lanka | 0.10% | 14,191 | 2022 |
| Uzbekistan | 0.10% | 12,518 | 2024 |
| El Salvador | 0.10% | 12,667 | 2023 |
| Bhutan | 0.10% | 17,762 | 2024 |
| Lesotho | 0.10% | 2,880 | 2023 |
| Kuwait | 0.09% | 53,119 | 2024 |
| Tajikistan | 0.09% | 3,654 | 2020 |
| Turkmenistan | 0.09% | 19,645 | 2023 |
| Mongolia | 0.08% | 16,399 | 2022 |
| Bolivia | 0.06% | 11,202 | 2021 |
| Honduras | 0.06% | 5,785 | 2019 |
| Kyrgyzstan | 0.05% | 8,208 | 2024 |
| Trinidad and Tobago | 0.05% | 32,974 | 2022 |
| Syria | 0.04% | 4,905 | 2022 |
| Iraq | 0.04% | 12,732 | 2021 |
| Myanmar | 0.02% | 5,958 | 2023 |
| Guatemala | 0.01% | 13,752 | 2023 |
EU-27 data as a table (2024)
| Economy | R&D, % of GDP | GDP per capita (PPS) | Year |
|---|---|---|---|
| Sweden | 3.53% | 44,772 | 2024 |
| Austria | 3.34% | 48,092 | 2024 |
| Belgium | 3.25% | 46,547 | 2024 |
| Finland | 3.22% | 40,872 | 2024 |
| Denmark | 3.15% | 51,785 | 2024 |
| Germany | 3.12% | 47,008 | 2024 |
| Netherlands | 2.37% | 53,149 | 2024 |
| France | 2.18% | 39,294 | 2024 |
| Slovenia | 2.14% | 36,151 | 2024 |
| Estonia | 1.98% | 31,583 | 2024 |
| Czechia | 1.82% | 36,256 | 2024 |
| Portugal | 1.73% | 33,093 | 2024 |
| Ireland | 1.59% | 88,343 | 2024 |
| Greece | 1.53% | 27,910 | 2024 |
| Spain | 1.50% | 36,497 | 2024 |
| Croatia | 1.41% | 31,543 | 2024 |
| Italy | 1.41% | 39,221 | 2024 |
| Poland | 1.40% | 31,463 | 2024 |
| Hungary | 1.31% | 30,450 | 2024 |
| Lithuania | 1.12% | 35,288 | 2024 |
| Luxembourg | 1.04% | 98,982 | 2024 |
| Slovakia | 0.98% | 30,226 | 2024 |
| Latvia | 0.94% | 27,792 | 2024 |
| Bulgaria | 0.77% | 26,453 | 2024 |
| Cyprus | 0.64% | 41,190 | 2024 |
| Malta | 0.61% | 43,805 | 2024 |
| Romania | 0.46% | 30,915 | 2024 |
Sources: World Bank, WDI (GB.XPD.RSDV.GD.ZS from UNESCO UIS and NY.GDP.PCAP.PP.CD, updated 8 October 2026); Eurostat, rd_e_gerdtot and nama_10_pc. Calculation: Omnia Solutions.
Methodology: the sample includes all economies for which the World Bank publishes both R&D expenditure as a share of GDP (2019 to 2024) and GDP per capita at purchasing power parity for the same year. Taiwan is not included because the World Bank does not cover it. World Bank and UNESCO values for individual countries may differ from Eurostat and OECD figures because of different revision dates. The coefficients are calculated from the data in the tables below the chart, so the calculation can be reproduced.
How much would Croatia need to invest to reach the EU average or 3%?
With 2025 GDP of EUR 94.0 billion (Eurostat provisional data), a share of 1.41% corresponds to about EUR 1.33 billion a year. The EU average of 2.26% would require about EUR 2.12 billion, or about EUR 0.8 billion more, and the 3% target about EUR 2.82 billion, or about EUR 1.5 billion more per year.
Croatia's National Development Strategy to 2030 sets a target of 3% of GDP, the same as the EU target. If the average growth of 2014–2024 continues, about 0.06 percentage points a year, the share would reach about 1.8% of GDP in 2030.
Calculator
How much Croatia would need to invest for a target share of GDP
Choose a target share. The calculation uses Croatia's 2025 GDP of EUR 94.0 billion (provisional) and compares it with the current share of 1.41%.
The calculation is an illustration at the 2025 GDP level and does not include GDP growth or inflation. Actual R&D expenditure in 2024 was EUR 1.21 billion. In the EU, businesses perform about two thirds of R&D.
Sources: Eurostat, nama_10_gdp (2025 GDP, updated 22 October 2026) and rd_e_gerdtot. Calculation: Omnia Solutions.
What this means for businesses
Companies developing new products, processes and technologies in Croatia can reduce the cost of R&D through several sources:
- Tax relief for R&D projects. The Act on State Aid for Research and Development Projects (Zakon o državnoj potpori za istraživačko-razvojne projekte, NN 64/18 and 152/24) provides an additional reduction of the tax base of 400% of eligible costs for fundamental research, 300% for industrial research and feasibility studies, and 250% for experimental development, within the aid intensity limits. The maximum aid per company and project is EUR 300,000 for fundamental research, EUR 200,000 for industrial research, EUR 100,000 for experimental development and EUR 50,000 per feasibility study, and a project may last up to three consecutive fiscal years. Beneficiary status is confirmed by the Ministry of Economy, and the procedure is set out in a rulebook from May 2025 (NN 77/25).
- EU grants. For research, development and innovation, businesses use calls such as Integrator (grants of EUR 300,000 to 820,000), STEP SPIN for consortia and the call for start-up and spin-off companies of young researchers (up to EUR 200,000 according to the draft guidelines). Each comes with an eligibility questionnaire, and open calls are listed in our guide to grants and EU funds.
- Investment tax incentives. The Investment Promotion Act (Zakon o poticanju ulaganja) includes development and innovation activities among eligible activities, provides higher support per new job for them, and supports high-tech equipment with up to 20% of the cost, at most EUR 500,000. The conditions are explained in our guide to investment tax incentives.
- Horizon Europe and the European Innovation Council (EIC). For projects with European partners and high-risk innovation. Before applying it helps to assess the technology readiness level (TRL), and we have written about the future of these programmes in our analysis of the next EU budget.
These sources can be combined, subject to the rules on cumulation of state aid for the same costs.
Developing a new product, process or technology?
Let us check which support your R&D project can apply for
We will review your project and suggest a combination of tax relief, grants and other sources. The introductory call is free.
Frequently asked questions
How much does Croatia invest in R&D?
According to Eurostat, Croatia invested EUR 1,208.8 million in research and development in 2024, or 1.41% of GDP. This is EUR 313 per inhabitant and 16th place in the EU, level with Italy. Since 2014, when it was 0.77%, the share has risen by 0.64 percentage points.
How much does the EU invest in R&D, and what is the target?
In 2024 the EU invested EUR 408.4 billion in research and development, or 2.26% of GDP. The target set by the European Council is 3% of GDP, which six Member States exceed: Sweden (3.53%), Austria (3.34%), Belgium (3.25%), Finland (3.22%), Denmark (3.15%) and Germany (3.12%).
Which country spends the most on R&D?
According to the OECD, Israel invests the largest share of GDP (6.76% in 2024), followed by South Korea (5.13%) and Taiwan (4.10%). The United States invests 3.44%, China 2.69%, and the OECD average is 2.72%.
Is R&D spending linked to GDP per capita?
Yes, moderately and positively. Across 113 economies in World Bank data the correlation coefficient is 0.50, and the rank correlation 0.67. The link does not prove causation and weakens markedly among high-income economies (Pearson 0.11, rank 0.34), where some rich countries invest little while Israel and South Korea invest much more than expected.
How much would Croatia need to invest to reach the EU average?
With 2025 GDP of EUR 94.0 billion, the EU average of 2.26% would mean about EUR 2.12 billion a year, about EUR 0.8 billion more than at the current share of 1.41%. The 3% target, also set in the National Development Strategy to 2030, would require about EUR 1.5 billion more per year.
What support can businesses in Croatia use for R&D?
Businesses can use tax relief under the Act on State Aid for Research and Development Projects (an additional tax base reduction of 250% to 400% of eligible costs), EU grants such as Integrator, STEP SPIN and the call for start-up and spin-off companies of young researchers, investment tax incentives, and the Horizon Europe and European Innovation Council programmes.
Sources and methodology
- Eurostat: gross domestic expenditure on R&D by sector (rd_e_gerdtot) and by source of funds (rd_e_gerdfund), updated 29 September 2026
- Eurostat: GDP per capita in purchasing power standards (nama_10_pc) and GDP (nama_10_gdp), updated 22 October 2026
- Eurostat: EU spending on R&D exceeded €403 billion in 2024 (4 December 2025)
- OECD: Main Science and Technology Indicators (MSTI) and the March 2026 release
- World Bank: Research and development expenditure (% of GDP), source UNESCO UIS and GDP per capita, PPP, updated 8 October 2026
- DZS: Research and development in 2024 (Istraživanje i razvoj u 2024., 28 July 2026)
- Act amending the Act on State Aid for Research and Development Projects (NN 152/24), Rulebook on State Aid for Research and Development Projects (NN 77/25) and the draft act with explanatory notes and the National Development Strategy 2030 target
Figures according to the sources listed, as of 23 October 2026. Eurostat and the OECD revise their data, so some figures differ from earlier releases (for example, the Eurostat news item of 4 December 2025 gave an EU average of 2.2% and EUR 403.1 billion for 2024).