Updated on 30 October 2026. The chart data were downloaded from Eurostat on 30 October 2026. According to Eurostat data for the first half of 2026 (datasets updated on 19 October 2026), the electricity price for medium-sized industrial consumers in Croatia rose to EUR 161.0/MWh (EU average 180.0) and the gas price to EUR 51.0/MWh (EU 61.6). The text and charts refer to the second half of 2025, the latest period published at the time of writing.
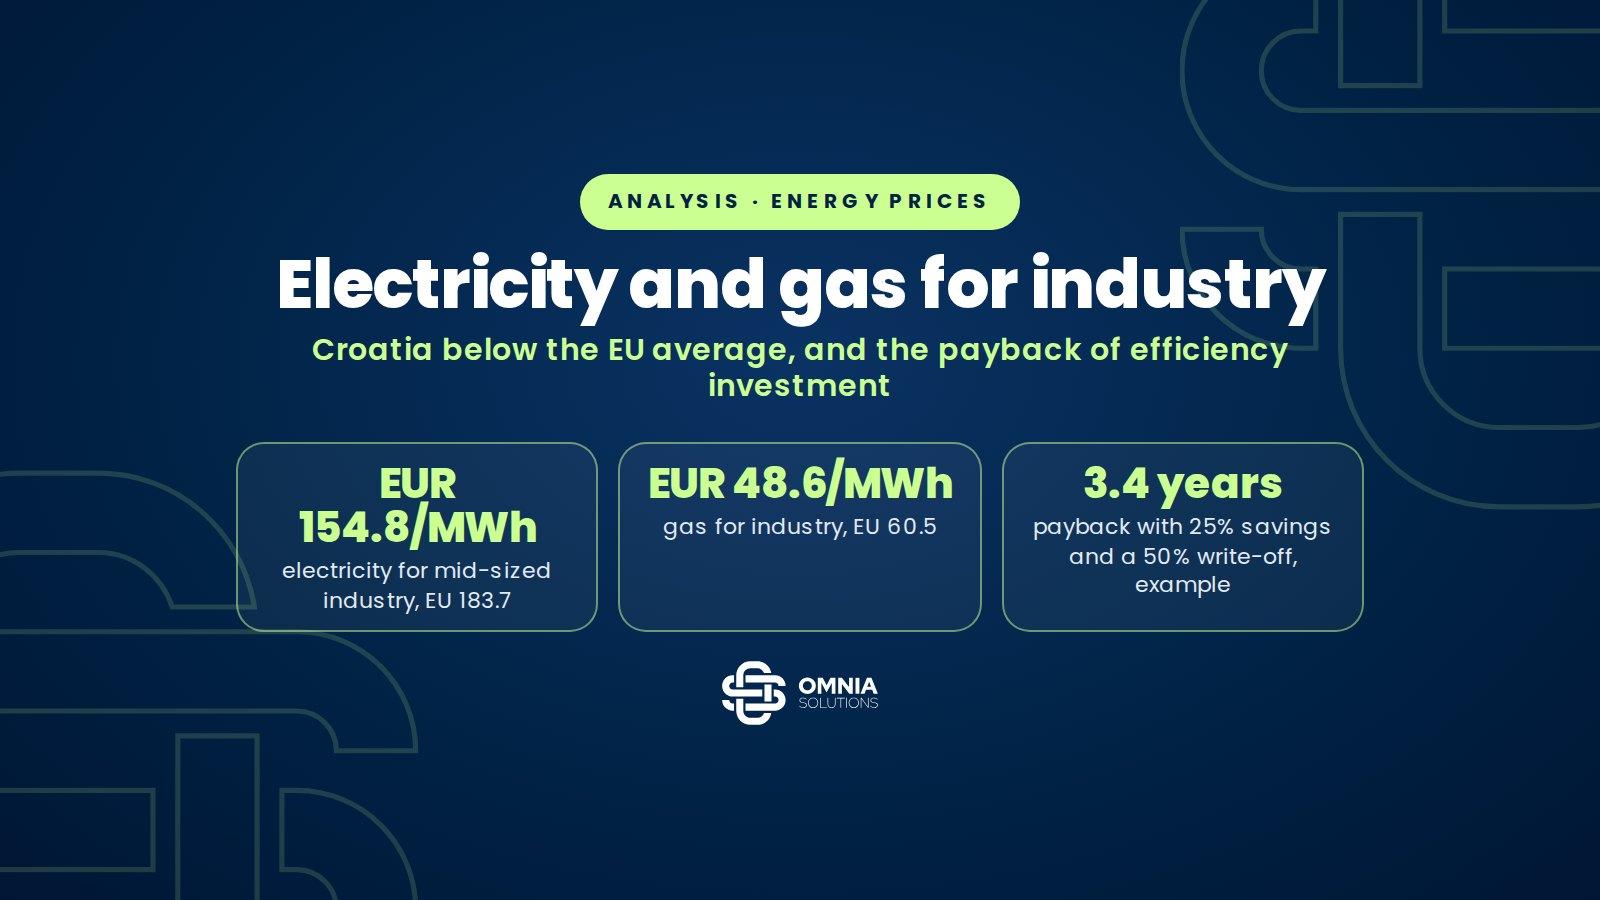
In the second half of 2025 medium-sized industrial firms in Croatia paid EUR 154.8 per megawatt hour for electricity excluding VAT, 15.7% less than the EU average (183.7), and EUR 48.6 per megawatt hour for gas, 19.7% below the average (60.5). Croatia is the 12th cheapest of 27 member states for electricity and the fifth cheapest of 25 for gas. The picture is different from 2023, when the Croatian electricity price peaked at EUR 292.5 during the crisis, 36% above the EU average. It has since fallen by 47% but is still 51% higher than in the first half of 2021. For a medium-sized manufacturer with an annual energy bill of EUR 349,200, a EUR 600,000 investment that cuts energy use by 25% pays back in 6.9 years, or in 3.4 years with HBOR’s energy efficiency loan and a write-off of half the principal.
This analysis uses Eurostat’s half-yearly data on electricity and gas prices for non-household consumers, published on 8 May 2026, and the terms of HBOR’s Energy Efficiency Loans for Entrepreneurs programme. It shows where Croatia stands among member states, how prices have moved since 2021, what share of the price goes on taxes and levies and, with a simple example, when an efficiency investment pays off.
In brief
- Electricity for medium-sized industrial consumers (500 to 2,000 MWh a year) costs EUR 154.8/MWh excluding VAT in Croatia, against 183.7 in the EU. Ireland (255.2), Cyprus (242.9) and Germany (226.4) are the most expensive, Finland (74.8) and Sweden (97.0) the cheapest.
- Gas for medium-sized industrial consumers costs EUR 48.6/MWh, against 60.5 in the EU. It is more expensive in Slovenia (57.7), Austria (64.1) and Germany (71.3) and cheaper only in Belgium, Portugal, Greece and Bulgaria.
- In the first half of 2023 the Croatian electricity price was 36% above the EU average; in the second half of 2025 it was 16% below it. The fall over one year was 12.2%, more than twice the EU’s 5.4%.
- Non-recoverable levies make up 8.9% of the Croatian electricity price excluding VAT, against 17.7% in the EU. Low levies are the main reason Croatia is cheaper than average.
- HBOR’s energy efficiency loan is funded half from the ERDF at 0% and half by a bank, up to EUR 3 million, with up to 50% of the principal written off if savings of at least 20% are achieved in production.
- In the example in this article a EUR 600,000 investment with 25% savings pays back in 6.9 years without a write-off, 5.2 years with a 25% write-off and 3.4 years with a 50% write-off.
Sources: 7, listed at the end · How we check our information · Report an error
Key figures
Energy prices for non-household consumers, second half of 2025
Source: Eurostat, nrg_pc_205 and nrg_pc_203 (prices excluding VAT and other recoverable taxes and levies); HBOR, Energy Efficiency Loans for Entrepreneurs. Calculation: Omnia Solutions.
How much Croatian industry pays for electricity compared with the EU
Eurostat tracks business energy prices by annual consumption band. The most suitable band for comparison is IC, from 500 to 2,000 megawatt hours a year, which covers most medium-sized manufacturers. Eurostat’s headline figure is the price excluding VAT and other recoverable levies, because businesses deduct VAT, and this article uses the same measure.
In the second half of 2025 the Croatian price in this band was EUR 154.8 per megawatt hour, against an EU average of 183.7. Croatia is the 16th most expensive member state, or the 12th cheapest, below the median of 171.7. Germany (226.4), Italy (220.3) and Poland (193.5) pay more, as do Hungary (213.2) and Slovakia (209.0). Cheaper countries include Slovenia (150.3), France (153.4) and Spain (132.4), with Sweden (97.0) and Finland (74.8), rich in hydropower and nuclear, the cheapest.
Interactive chart
EU member states: electricity prices for businesses, second half of 2025
Ireland
Cyprus
Germany
Italy
Hungary
Slovakia
Netherlands
Austria
Poland
Romania
Belgium
EU-27 average
Czechia
Greece
Luxembourg
Lithuania
Croatia
France
Slovenia
Bulgaria
Estonia
Latvia
Malta
Portugal
Spain
Denmark
Sweden
Finland
Band IC, annual consumption of 500 to 2,000 MWh, typical of a medium-sized manufacturer. Price excluding VAT and other recoverable levies, Eurostat’s headline measure for businesses. Croatia is the 16th most expensive, 15.7% below the EU average. The figure for Austria is an estimate.
Show the data in a table
| Country | 500 to 2,000 MWh, excl. VAT | 500 to 2,000 MWh, all taxes | 2,000 to 20,000 MWh, excl. VAT | 20 to 500 MWh, excl. VAT |
|---|---|---|---|---|
| Ireland | 255.2 EUR/MWh | 277.1 EUR/MWh | 218.7 EUR/MWh | 291.5 EUR/MWh |
| Cyprus | 242.9 EUR/MWh | 286.8 EUR/MWh | 236.6 EUR/MWh | 251.9 EUR/MWh |
| Germany | 226.4 EUR/MWh | 272.2 EUR/MWh | 192.2 EUR/MWh | 261.8 EUR/MWh |
| Italy | 220.3 EUR/MWh | 254.4 EUR/MWh | 194.8 EUR/MWh | 237.7 EUR/MWh |
| Hungary | 213.2 EUR/MWh | 266.5 EUR/MWh | 187.6 EUR/MWh | 243.4 EUR/MWh |
| Slovakia | 209.0 EUR/MWh | 248.7 EUR/MWh | 183.9 EUR/MWh | 236.6 EUR/MWh |
| Netherlands | 201.1 EUR/MWh | 240.9 EUR/MWh | 181.1 EUR/MWh | 242.4 EUR/MWh |
| Austria | 198.6 EUR/MWh | 238.3 EUR/MWh | 179.9 EUR/MWh | 232.0 EUR/MWh |
| Poland | 193.5 EUR/MWh | 238.1 EUR/MWh | 173.5 EUR/MWh | 263.5 EUR/MWh |
| Romania | 188.7 EUR/MWh | 227.7 EUR/MWh | 171.5 EUR/MWh | 214.2 EUR/MWh |
| Belgium | 186.6 EUR/MWh | 225.8 EUR/MWh | 157.1 EUR/MWh | 215.8 EUR/MWh |
| EU-27 average | 183.7 EUR/MWh | 220.6 EUR/MWh | 159.6 EUR/MWh | 217.9 EUR/MWh |
| Czechia | 182.5 EUR/MWh | 220.8 EUR/MWh | 163.6 EUR/MWh | 230.2 EUR/MWh |
| Greece | 173.8 EUR/MWh | 184.2 EUR/MWh | 162.1 EUR/MWh | 219.8 EUR/MWh |
| Luxembourg | 171.7 EUR/MWh | 186.0 EUR/MWh | 144.4 EUR/MWh | 205.1 EUR/MWh |
| Lithuania | 159.1 EUR/MWh | 192.0 EUR/MWh | 136.1 EUR/MWh | 185.0 EUR/MWh |
| Croatia | 154.8 EUR/MWh | 174.9 EUR/MWh | 138.6 EUR/MWh | 178.5 EUR/MWh |
| France | 153.4 EUR/MWh | 181.5 EUR/MWh | 121.2 EUR/MWh | 194.6 EUR/MWh |
| Slovenia | 150.3 EUR/MWh | 183.4 EUR/MWh | 141.6 EUR/MWh | 157.6 EUR/MWh |
| Bulgaria | 141.3 EUR/MWh | 169.5 EUR/MWh | 135.5 EUR/MWh | 150.8 EUR/MWh |
| Estonia | 141.0 EUR/MWh | 174.8 EUR/MWh | 129.4 EUR/MWh | 152.0 EUR/MWh |
| Latvia | 136.1 EUR/MWh | 164.7 EUR/MWh | 116.2 EUR/MWh | 164.1 EUR/MWh |
| Malta | 135.9 EUR/MWh | 142.0 EUR/MWh | 117.0 EUR/MWh | 151.2 EUR/MWh |
| Portugal | 132.9 EUR/MWh | 162.2 EUR/MWh | 121.6 EUR/MWh | 171.0 EUR/MWh |
| Spain | 132.4 EUR/MWh | 158.9 EUR/MWh | 119.1 EUR/MWh | 161.8 EUR/MWh |
| Denmark | 121.6 EUR/MWh | 271.2 EUR/MWh | 123.2 EUR/MWh | 134.7 EUR/MWh |
| Sweden | 97.0 EUR/MWh | 121.3 EUR/MWh | 85.2 EUR/MWh | 114.0 EUR/MWh |
| Finland | 74.8 EUR/MWh | 93.8 EUR/MWh | 67.4 EUR/MWh | 92.3 EUR/MWh |
Source: Eurostat, nrg_pc_205, second half of 2025, EUR per kWh converted to EUR per MWh. Ranking: Omnia Solutions.
The ranking depends on the band and on taxes. Including all taxes and levies, Croatia is the 19th most expensive at EUR 174.9, because Croatian levies on electricity are low. For larger consumers, from 2,000 to 20,000 megawatt hours, the price is EUR 138.6, 13.2% below the EU average. For small businesses and crafts, from 20 to 500 megawatt hours, it is EUR 178.5, 18.1% below the average.
What gas costs and where Croatia stands
Gas for medium-sized industrial consumers, in the band from 10,000 to 100,000 gigajoules a year, costs EUR 48.6 per megawatt hour excluding VAT in Croatia, against 60.5 in the EU. Croatia is the 21st most expensive of the 25 member states with grid gas. Gas is most expensive in Sweden (106.5), Finland (86.3) and Germany (71.3) and cheapest in Bulgaria (41.4) and Greece (42.4). Slovenia pays 57.7, Austria 64.1 and Italy EUR 51.3.
Chart
EU member states: gas prices for businesses, second half of 2025
Sweden
Finland
Germany
Netherlands
Ireland
Luxembourg
Poland
Austria
Slovakia
Denmark
France
EU-27 average
Slovenia
Czechia
Estonia
Latvia
Hungary
Romania
Italy
Spain
Lithuania
Croatia
Belgium
Portugal
Greece
Bulgaria
Band I3, annual consumption of 10,000 to 100,000 GJ (about 2,800 to 27,800 MWh), price on a gross calorific value basis. Cyprus and Malta have no grid gas. Croatia is the 21st most expensive of 25, 19.7% below the EU average.
Show the data in a table
| Country | 10,000 to 100,000 GJ, excl. VAT |
|---|---|
| Sweden | 106.5 EUR/MWh |
| Finland | 86.3 EUR/MWh |
| Germany | 71.3 EUR/MWh |
| Netherlands | 67.4 EUR/MWh |
| Ireland | 66.7 EUR/MWh |
| Luxembourg | 65.7 EUR/MWh |
| Poland | 64.7 EUR/MWh |
| Austria | 64.1 EUR/MWh |
| Slovakia | 64.0 EUR/MWh |
| Denmark | 63.2 EUR/MWh |
| France | 62.9 EUR/MWh |
| EU-27 average | 60.5 EUR/MWh |
| Slovenia | 57.7 EUR/MWh |
| Czechia | 56.8 EUR/MWh |
| Estonia | 56.7 EUR/MWh |
| Latvia | 52.8 EUR/MWh |
| Hungary | 51.8 EUR/MWh |
| Romania | 51.4 EUR/MWh |
| Italy | 51.3 EUR/MWh |
| Spain | 50.8 EUR/MWh |
| Lithuania | 50.8 EUR/MWh |
| Croatia | 48.6 EUR/MWh |
| Belgium | 48.1 EUR/MWh |
| Portugal | 48.1 EUR/MWh |
| Greece | 42.4 EUR/MWh |
| Bulgaria | 41.4 EUR/MWh |
Source: Eurostat, nrg_pc_203, second half of 2025, EUR per kWh converted to EUR per MWh. Ranking: Omnia Solutions.
How prices have moved since 2021
The Croatian curve is steeper than the European one in both directions. In the first half of 2021 medium-sized Croatian industry paid EUR 102.5 per megawatt hour for electricity, 21% below the EU average. By the first half of 2023 the price had almost tripled to EUR 292.5, while the EU average reached 215.1. Croatia was then 36% more expensive than the EU average, a direct blow to manufacturers’ competitiveness. A rapid fall followed, to EUR 154.8 in the second half of 2025, down 47%, while the EU average fell by 15%.
Interactive chart
Electricity and gas prices for medium-sized industrial consumers since 2021, EUR per MWh
Show the data in a table
| Half-year | Croatia, electricity | EU-27, electricity | Croatia, gas | EU-27, gas |
|---|---|---|---|---|
| H1 2021 | 102.5 | 129.0 | 29.4 | 30.2 |
| H2 2021 | 114.2 | 144.7 | 38.2 | 41.9 |
| H1 2022 | 155.4 | 183.7 | 56.1 | 65.6 |
| H2 2022 | 239.1 | 210.7 | 81.9 | 86.7 |
| H1 2023 | 292.5 | 215.1 | 65.1 | 82.4 |
| H2 2023 | 233.2 | 200.3 | 63.0 | 69.1 |
| H1 2024 | 205.1 | 188.5 | 53.1 | 61.9 |
| H2 2024 | 176.4 | 194.1 | 52.2 | 64.0 |
| H1 2025 | 173.8 | 190.3 | 51.5 | 66.0 |
| H2 2025 | 154.8 | 183.7 | 48.6 | 60.5 |
Electricity band IC (500 to 2,000 MWh), gas band I3 (10,000 to 100,000 GJ), prices excluding VAT and recoverable levies. Solid lines show electricity, dashed lines gas. Hover over or tap the chart.
Source: Eurostat, nrg_pc_205 and nrg_pc_203, half-yearly data from the first half of 2021 to the second half of 2025.
Gas went through a similar cycle with an earlier peak. The Croatian price rose from EUR 29.4 in the first half of 2021 to 81.9 in the second half of 2022 and then fell to 48.6, down 41%. In the EU the peak was 86.7, and the fall to 60.5 amounts to 30%. Compared with 2021, gas is 65% more expensive in Croatia and twice as expensive in the EU. Energy prices have remained volatile, so the assumption of stable prices is the weakest link in any payback calculation.
The gap between Croatia and the EU comes mainly from levies. The electricity price excluding all taxes in the second half of 2025 was EUR 141.0 in Croatia and 151.1 in the EU, only 7% lower. Non-recoverable taxes and levies, such as renewable energy surcharges and excise duties, make up 8.9% of the price excluding VAT in Croatia and 17.7% in the EU. Of the total gap of EUR 28.9 per megawatt hour, EUR 18.8 is down to levies, almost two thirds. Including all taxes the Croatian price is EUR 174.9, 13% above the price excluding VAT.
When an efficiency investment pays off: an example with an HBOR loan
Take a medium-sized manufacturer that uses 1,000 megawatt hours of electricity and 4,000 megawatt hours of gas a year. At prices for the second half of 2025 its energy bill is EUR 154,800 for electricity and EUR 194,400 for gas, EUR 349,200 a year in total. The company plans a EUR 600,000 investment excluding VAT in more efficient compressors, waste heat recovery, lighting and controls and a solar plant for its own use, and an energy audit estimates savings of 25% of energy. That is EUR 87,300 a year.
Without support the simple payback is 6.9 years. HBOR’s energy efficiency loan changes the calculation in two places. Half of the loan, EUR 300,000, comes from the European Regional Development Fund at 0% interest, and the other half from a bank at a rate the bank sets. Assuming 4.5% a year and a term of 10 years with a one-year grace period, total interest on the bank half is EUR 78,894 and the monthly instalment after the grace period is EUR 3,383. If the whole amount were a bank loan at the same rate, interest would be double, EUR 157,788.
Worked example
A medium-sized manufacturer: a EUR 600,000 investment with an HBOR loan
Source: Omnia Solutions calculation based on Eurostat prices for the second half of 2025 and the terms of HBOR’s Energy Efficiency Loans for Entrepreneurs programme. Assumptions and formula in the methodology.
The second is the capital rebate. If the company proves the savings after implementation, HBOR writes off up to 50% of the principal disbursed, and the write-off is charged to the ERDF part. The write-off is tiered at 15, 25, 35 or 50%, depending on the percentage and amount of energy saved and on whether renewable energy equipment is installed, so the top rate is not automatic. In the best case the company repays only the bank’s EUR 300,000 with interest, and the payback falls to 3.4 years. With a 25% write-off the payback is 5.2 years. Over ten years savings of EUR 873,000 exceed the principal repaid and interest by EUR 494,106 with a 50% write-off, or by EUR 194,106 without one.
Chart
Payback on a EUR 600,000 investment in years, by energy saving and principal write-off
Saving 20% of energy (EUR 69,840 a year)
Saving 25% of energy (EUR 87,300 a year)
Saving 30% of energy (EUR 104,760 a year)
Simple payback = (investment minus write-off) / annual saving. The saving is calculated from an annual energy bill of EUR 349,200. Interest on the bank part of the loan is not included in the payback and is shown separately in the tiles.
Source: Omnia Solutions calculation. The write-off depends on the savings achieved and the criteria in Annex 1 of HBOR’s programme; 25% and 50% are scenarios, not a promise.
The chart shows how sensitive the result is to the actual saving. With a 20% saving, HBOR’s threshold for production, the payback is 8.6 years without a write-off and 4.3 years with a 50% write-off. A five-year payback without a write-off would require savings of 34.4% of the energy bill. With a 50% write-off 17.2% would be enough on paper, but that is below HBOR’s 20% threshold, so in practice the threshold itself is the floor. The calculation does not include rising energy prices. Had prices stayed at the level of the first half of 2023, the same 25% saving would have been worth EUR 138,225 a year and the payback would have been under five years even without a write-off. The principal write-off thus cushions the risk that prices stay low and the investment turns out slower than planned.
What HBOR’s programme offers and where its limits are
The Energy Efficiency Loans for Entrepreneurs programme is funded from the Competitiveness and Cohesion Programme 2021 to 2027. It is open to companies of all sizes, large ones included, in manufacturing, trade, tourism and services that have been registered for the activity for at least one year. Loans go up to EUR 3 million, with a repayment period of up to 17 years including a grace period of up to 3 years. Applications go to one of five banks, Erste, HPB, OTP, PBZ or Raiffeisenbank, not to HBOR directly. Disbursements are possible until 31 December 2029, and the write-off criteria can also be met later.
The investment must cut delivered energy by at least 20% in production, 30% in trade and services, or 50% for heating and cooling of buildings serving production, as confirmed by an energy audit or study. Efficiency measures and renewables for own use are eligible, and costs not directly linked to the saving may account for up to 30% of the loan. Refinancing and works completed before approval are not eligible, and participants in the emissions trading system need the ministry’s consent. Each beneficiary can receive only one loan under the programme. We describe the terms and procedure in our guide to HBOR’s energy efficiency loans and the write-off mechanism in our article on the capital rebate.
In April 2026 the Ministry of Environmental Protection and Green Transition published call MF-2026-2-1 under the Modernisation Fund, the other major source for energy investments. The call is worth EUR 80 million and open until 7 August 2026, but only for district heating suppliers. For most manufacturers HBOR’s loan with a principal write-off is therefore the most direct instrument for energy efficiency investment in July 2026.
What this means for businesses
- Energy prices have fallen from their peak but are 51% (electricity) and 65% (gas) higher than in 2021. An investment with a ten-year payback at 2021 prices pays back in six to seven years at today’s prices, and in about three with half of the principal written off.
- The key figure in an application is the percentage saving confirmed by the energy audit. A project with a 20% saving only just clears the threshold, and each additional percentage point shortens the payback and can increase the write-off.
- Interest on the bank part of the loan varies from bank to bank. You can compare the total cost of the loan, including fees and the grace period, in our HBOR loan calculator, and all programmes in our guide HBOR loans for entrepreneurs 2026.
- If the energy-saving investment also includes new production equipment, compare it with HBOR’s production modernisation loan, which links the write-off to Industry 4.0 and digitalisation. Each beneficiary can have only one loan per programme.
- The principal write-off is state aid and, for the same costs, is added to investment tax incentives and other aid, and the total must not exceed the maximum permitted intensity. How Croatia uses state aid compared with the EU is covered in our article on state aid in Croatia and the EU.
Methodology: prices come from Eurostat datasets nrg_pc_205 (electricity) and nrg_pc_203 (gas) for non-household consumers, half-yearly data from the first half of 2021 to the second half of 2025. Values in euros per kilowatt hour were multiplied by 1,000 and expressed in euros per megawatt hour. The headline price level excludes VAT and other recoverable taxes and levies, as Eurostat uses it in its releases for businesses. Band IC covers annual electricity consumption of 500 to 1,999 MWh, band I3 gas consumption of 10,000 to 99,999 GJ on a gross calorific value basis. Member states are ranked from most to least expensive using exact values. The payback example uses the formula payback in years = (investment minus principal write-off) / annual saving, where the annual saving equals the annual energy bill multiplied by the percentage saving. The assumptions are consumption of 1,000 MWh of electricity and 4,000 MWh of gas, prices for the second half of 2025, a EUR 600,000 investment excluding VAT fully financed by the loan, a fixed bank rate of 4.5% a year on half of the loan, and a term of 10 years with a one-year grace period in which only interest is paid, followed by 108 equal monthly instalments. Interest is not included in the simple payback and is shown separately. The write-off percentage depends on the savings achieved and the criteria in Annex 1 of HBOR’s programme, and 25% and 50% are illustrative scenarios. All calculations were reproduced in Python.
Frequently asked questions
How much does Croatian industry pay for electricity compared with the EU?
In the second half of 2025 medium-sized industrial consumers (500 to 2,000 MWh a year) in Croatia paid EUR 154.8 per megawatt hour excluding VAT, 15.7% less than the EU average of 183.7. Croatia is the 12th cheapest of 27 member states. Ireland, Cyprus and Germany are the most expensive, Finland and Sweden the cheapest.
How much does gas cost for businesses in Croatia?
Gas in the band from 10,000 to 100,000 gigajoules a year costs EUR 48.6 per megawatt hour excluding VAT, 19.7% less than the EU average (60.5). It is cheaper only in Belgium, Portugal, Greece and Bulgaria, and more expensive in Slovenia, Austria and Germany.
Are energy prices still higher than before the crisis?
Yes. In the second half of 2025 electricity for medium-sized Croatian industry was 47% cheaper than at its peak in the first half of 2023 but 51% more expensive than in the first half of 2021. Gas is 41% cheaper than at its peak at the end of 2022 and 65% more expensive than in 2021.
What does HBOR’s energy efficiency loan offer?
A loan of up to EUR 3 million, half from the European Regional Development Fund at 0% interest and half from a bank at its own rate, with a term of up to 17 years and a grace period of up to 3 years. If the investment cuts energy use by at least 20% in production or 30% in services, HBOR writes off up to 50% of the principal. Applications go to one of five banks.
When does an energy efficiency investment pay off?
In the example of a company with an energy bill of EUR 349,200 a year, a EUR 600,000 investment that saves 25% of energy pays back in 6.9 years without support, in 5.2 years with a 25% principal write-off and in 3.4 years with a 50% write-off. The result depends most on the actual saving and on how energy prices move.
Can the principal write-off be combined with other aid?
Yes. The principal write-off is granted as state aid, so for the same eligible costs it is added to tax incentives and other aid. The total must not exceed the maximum permitted aid intensity, which depends on company size and region, and the write-off may be smaller than 50% if that intensity would otherwise be exceeded.

About the author
Matija Vlahovski, MSc in Economics
Co-founder and director of Omnia Solutions. He has more than ten years of experience in business financing, mostly with HAMAG-BICRO loans, HBOR loans, investment studies and tax incentives. He has taken part in more than 90 projects, through which clients were awarded more than EUR 12 million in grants and more than EUR 2 million in tax incentives. Before consulting, he worked at Privredna banka Zagreb, preparing loan proposals for small and medium-sized enterprises. He holds a HANFA licence.
Sources
- Eurostat, Non-household electricity prices in 2nd half of 2025 (8 May 2026)
- Eurostat, Non-household gas prices in 2nd half of 2025 (8 May 2026)
- Eurostat, nrg_pc_205, electricity prices for non-household consumers, Croatia, band IC
- Eurostat, nrg_pc_203, gas prices for non-household consumers, Croatia, band I3
- HBOR, Energy Efficiency Loans for Entrepreneurs, programme terms (in Croatian)
- Ministry of Environmental Protection and Green Transition and FZOEU, call MF-2026-2-1 (8 April 2026, in Croatian)
- FZOEU, Croatian businesses received EUR 30 million from the Modernisation Fund
Planning an energy efficiency investment?
Let us calculate the payback for your project and check the terms of HBOR’s loan with a principal write-off
We will review your energy use, the planned measures and the savings from the energy audit, and prepare a payback calculation and the loan application. The introductory call is free.