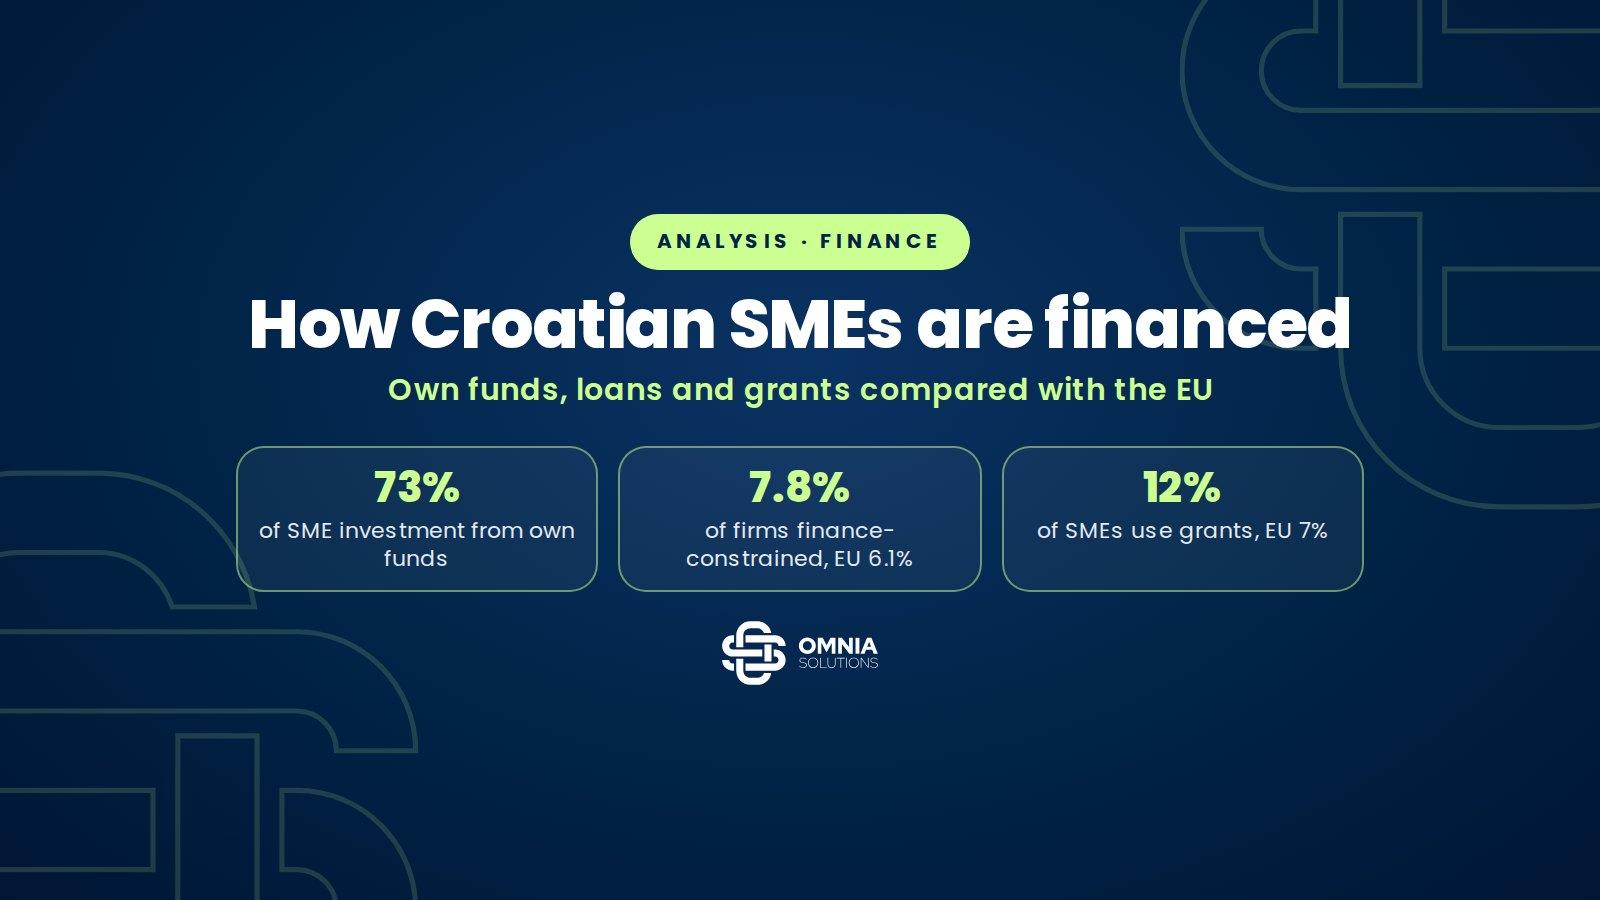
Croatian firms finance their investment mostly with their own money. According to the European Investment Bank Investment Survey (EIBIS 2025), 78% of investment value in the last financial year came from own funds and 21% from external sources, against 66 and 25% in the EU. Small and medium-sized enterprises (SMEs) finance 73% of their investment from own funds. 43% of investing firms use external finance, almost as many as in the EU, but they rely less on banks (68% against 79%). 12% of Croatian SMEs use grants and subsidised loans, against 7% in the EU. The share of finance-constrained firms is 7.8%, slightly above the EU average of 6.1%.
The analysis draws on sources published by June 2026. These are the EIB Investment Survey 2025, the 2025 Survey on the access to finance of enterprises (SAFE) by the European Commission and the European Central Bank, the Commission’s SME Performance Review and the annual reports of HBOR for 2025 and HAMAG-BICRO for 2023. It shows how much firms invest from their own money, how they compare with neighbouring member states, how hard it is to obtain credit and how much public sources cover.
In brief
- Croatia has 258,507 SMEs, 99.8% of all enterprises. They employ 72.1% of the business sector workforce and generate 64.0% of value added (estimates for 2025).
- Own funds cover 78% of investment by Croatian firms, the highest share among 11 Central and Eastern European member states. For SMEs the share is 73%, for large firms 84%.
- Of the firms that use external finance, 68% use bank finance, against 79% in the EU. 6% are dissatisfied with the cost of finance, against 15% in the EU.
- 7.8% of firms are finance-constrained. The Croatian share has been above the EU average every year since 2019 and peaked in 2021 (11.4%). Construction has the hardest time (12.4%).
- 12% of Croatian SMEs use grants or subsidised loans, and 19% of investing firms received public support for investment, both above the EU average.
- In 2025 HBOR supported 1,654 projects with almost EUR 1.8 billion. It approved EUR 798 million to the private sector, 51% of it for 1,015 placements to SMEs.
Sources: 8, listed at the end · How we check our information · Report an error
Key figures
How Croatian firms finance investment
Source: European Investment Bank, EIB Investment Survey 2025 (Croatia and Central, Eastern and South-Eastern Europe); European Commission and ECB, SAFE 2025; HBOR, Annual Report 2025.
How much investment firms finance with their own money
Croatia has 258,507 small and medium-sized enterprises. According to the Commission’s SME Performance Review (SME Fact Sheet 2026, estimates for 2025), they make up 99.8% of enterprises, employ 986,475 people or 72.1% of the business sector workforce and generate EUR 33.4 billion or 64.0% of value added. Most are micro enterprises (241,076), and 2,352 are medium-sized. The EIB Investment Survey, carried out in Croatia every year, gives the most precise picture of how these firms finance investment.
In the 2025 survey 89% of Croatian firms invested in the last financial year, above the EU average of 86%. 78% of that investment was financed from own funds, meaning retained earnings and cash from operations, and 21% from external sources such as bank loans, leasing, grants and bonds. In the EU the split is 66 to 25%, with intra-group funding making up the rest. A year earlier the Croatian split was 72 to 27%, so reliance on own money has increased.
SMEs depend more on external money than large firms. They finance 26% of investment externally, large firms 16%, and 46% of investing SMEs use external finance, against 39% of large firms. By sector, manufacturing invests most from own money (82%) and construction most from external sources (29%). Of the firms using external finance, 68% use bank finance, against 79% in the EU.
Interactive chart
Sources of investment finance: Croatia and the EU, SMEs and large firms
Own funds, % of investment
External sources, % of investment
Firms using external finance
Bank finance among users of external finance
Own funds, % of investment
External sources, % of investment
Firms using external finance
Share of investment value in the last financial year, survey of 2025. The remainder to 100% is intra-group funding. The share of firms using external finance refers to firms that invested, bank finance to those that used external finance.
Show the data in a table
| Indicator | Croatia | EU average | Croatia, SMEs | Croatia, large firms |
|---|---|---|---|---|
| Own funds, % of investment | 78% | 66% | 73% | 84% |
| External sources, % of investment | 21% | 25% | 26% | 16% |
| Firms using external finance | 43% | 42% | 46% | 39% |
| Bank finance among users of external finance | 68% | 79% | – | – |
Source: European Investment Bank, EIB Investment Survey 2025, Croatia overview (December 2025). Values read from the report charts and checked against the figures in its text.
How Croatia compares with Central and Eastern Europe
Conservative financing is common across Central and Eastern Europe and strongest in Croatia. Among 11 Central and Eastern European member states, Croatian firms have the highest share of own funds in investment (78%), ahead of Latvia and Estonia (75% each). The regional average is 71% and the EU average 66%. Slovak (37%), Czech (29%) and Bulgarian firms (28%) invest most from external sources, Estonian firms least (17%). Croatia ranks eighth of 11 with 21%.
The share of firms using any external source tells a different story. In Croatia it is 43%, the same as in Slovenia, Lithuania and Romania and almost the EU average (42%). Croatian firms therefore turn to loans and grants almost as often as others, but use them to finance a smaller part of their investment. This points to smaller loans, or to larger investments being postponed until enough own money has been accumulated.
Interactive chart
Central and Eastern Europe: how much investment firms fund themselves
Croatia
Latvia
Estonia
Poland
Lithuania
Hungary
Romania
CESEE average
Slovenia
Bulgaria
EU average
Czechia
Slovakia
With 78%, Croatian firms have the highest share of own funds in investment among the 11 Central and Eastern European member states. The EU average is 66% and the regional average 71%.
Show the data in a table
| Country | Own funds, % of investment | External sources, % of investment | Firms using external finance |
|---|---|---|---|
| Croatia | 78% | 21% | 43% |
| Latvia | 75% | 23% | 45% |
| Estonia | 75% | 17% | 29% |
| Poland | 74% | 22% | 42% |
| Lithuania | 73% | 20% | 43% |
| Hungary | 73% | 20% | 38% |
| Romania | 71% | 24% | 43% |
| CESEE average | 71% | 24% | 44% |
| Slovenia | 69% | 22% | 43% |
| Bulgaria | 68% | 28% | 46% |
| EU average | 66% | 25% | 42% |
| Czechia | 65% | 29% | 50% |
| Slovakia | 57% | 37% | 63% |
Source: European Investment Bank, EIB Investment Survey 2025, overview for Central, Eastern and South-Eastern Europe (January 2026). Ranking: Omnia Solutions.
How hard is it to get credit
The EIB measures access to finance by the share of finance-constrained firms, meaning firms that received less than they asked for, were rejected, or did not apply because finance was too expensive or they were discouraged. In Croatia 7.8% of firms are finance-constrained, in the EU 6.1% and in Central and Eastern Europe 9.3%. The Croatian share has been above the EU average every year since 2019, peaking at 11.4% in 2021. The gap narrowed from 6.7 points in 2021 to 1.7 points in 2025. Construction (12.4%) and infrastructure (9.7%) have the hardest time.
Interactive chart
Finance-constrained firms since 2019
Show the data in a table
| Survey year | Croatia | EU average |
|---|---|---|
| 2019 | 7.8% | 4.9% |
| 2020 | 6.7% | 5.6% |
| 2021 | 11.4% | 4.7% |
| 2022 | 10.3% | 6.2% |
| 2023 | 10.7% | 5.9% |
| 2024 | 7.6% | 6.7% |
| 2025 | 7.8% | 6.1% |
Finance-constrained firms received less than they asked for, were rejected, or did not apply because finance was too expensive or they were discouraged. The year is the survey year. Hover over or tap the chart.
Source: European Investment Bank, EIB Investment Survey 2025, Croatia overview, 2025 edition time series; the EU series is confirmed in the overview for Central, Eastern and South-Eastern Europe.
The price of credit is not the main problem. 6% of Croatian firms using external finance are dissatisfied with its cost, against 15% in the EU. According to the ECB’s quarterly euro area survey of April 2026, a net 24% of SMEs reported higher interest rates on bank loans, up from 13% in the previous round, and 17% of SMEs applied for a bank loan. These figures cover the euro area as a whole, because Croatia is not shown separately in the quarterly rounds.
The 2025 SAFE survey, which covers all member states, also shows why Croatian SMEs do not apply for credit lines. Only 21% cite sufficient own funds, the lowest share in the EU, where it is 41%. Fear of rejection is almost absent (1% or less), and 52% give other reasons, the highest share in the EU. The analytical report does not give a rejection rate for Croatia, and the Croatian sample of 160 firms is too small for a reliable estimate. In the EU, 70% of SMEs that applied for a credit line obtained the full amount and 7% were rejected.
Interactive chart
Croatia compared with the EU: difference in percentage points
Finance-constrained
Use external finance
External share of investment
Bank finance among users of external finance
Dissatisfied with the cost of finance
Received public support for investment
Used grants or subsidised loans
Used retained earnings or sale of assets
Trade credit not relevant
Equity not relevant
Do not apply for a credit line because own funds suffice
A positive value means the share is higher in Croatia than in the EU. Croatian firms rely less on banks (68% against 79%) and are less often dissatisfied with the cost of finance (6% against 15%), but the share of finance-constrained firms is higher (7.8% against 6.1%).
Show the data in a table
| Indicator | Croatia | EU average | Difference, points |
|---|---|---|---|
| Finance-constrained | 7.8% | 6.1% | +1.7 |
| Use external finance | 43% | 42% | +1 |
| External share of investment | 21% | 25% | −4 |
| Bank finance among users of external finance | 68% | 79% | −11 |
| Dissatisfied with the cost of finance | 6% | 15% | −9 |
| Received public support for investment | 19% | 16% | +3 |
| Used grants or subsidised loans | 12% | 7% | +5 |
| Used retained earnings or sale of assets | 24% | 15% | +9 |
| Trade credit not relevant | 84% | 69% | +15 |
| Equity not relevant | 69% | 85% | −16 |
| Do not apply for a credit line because own funds suffice | 21% | 41% | −20 |
Sources: European Investment Bank, EIB Investment Survey 2025, Croatia overview; European Commission and ECB, Survey on the access to finance of enterprises (SAFE) 2025, analytical report. Calculation: Omnia Solutions.
How much grants and public loans cover
Croatian SMEs use public money more than average. According to SAFE, 12% of SMEs used grants or subsidised bank loans, against 7% in the EU, which together with Hungary (13%) is among the highest shares in the Union. According to the EIB survey, 19% of investing Croatian firms received public support for financing investment, against 16% in the EU. 24% of SMEs used retained earnings or sale of assets, against 15% in the EU. Equity is not relevant for 69% of SMEs, against 85% in the EU, one of the lowest shares in the Union.
HBOR is the largest public financier. According to its 2025 annual report, submitted to the Croatian Parliament in June 2026, HBOR supported 1,654 projects with almost EUR 1.8 billion, with 78% of lending going to investment. It approved EUR 798 million to the private sector for investment and working capital, and 51% of that amount, about EUR 407 million, went to 1,015 placements to SMEs. Direct loans to SMEs from the National Recovery and Resilience Plan carry interest rates of 0.4 and 0.8%, and the report lists 214 such loans worth EUR 64 million. Interest was subsidised on 285 loans worth EUR 724.5 million since implementation began. Blended programmes with EU funds allow up to 50% of the principal to be written off.
HAMAG-BICRO works with smaller amounts, through loans and guarantees for bank loans. According to its latest available annual report, for 2023, it approved 193 individual guarantees from the ESI Funds worth EUR 101.4 million, 1,121 ESI Fund loans worth EUR 23.9 million, 438 rural development loans worth EUR 30.5 million and 329 loans from the National Recovery and Resilience Plan worth EUR 22.9 million. Across all its guarantee programmes HAMAG-BICRO has issued EUR 931.5 million in guarantees, and from the start of its operations to the end of 2023 it paid out EUR 75.1 million, about 8%. Against 258,507 SMEs, HBOR’s 1,015 placements in 2025 reach less than half a percent of firms, so bank finance remains the main external source.
What this means for businesses
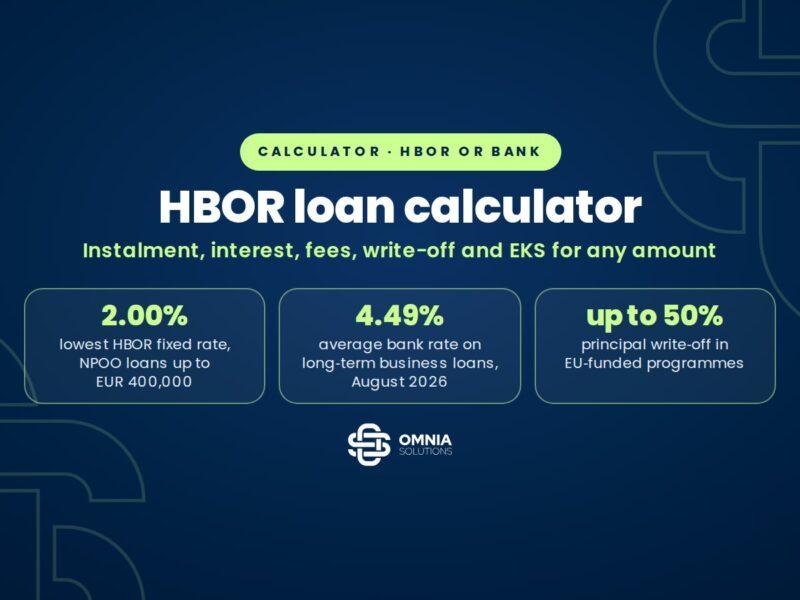
- Financing with own money keeps debt low but drains liquidity. If a project costs more than a year’s cash flow, it is worth comparing the total cost of an HBOR loan and a bank loan. Our HBOR loan calculator does this.
- HBOR programmes, their rates and conditions are described in our guide HBOR loans for entrepreneurs 2026. For programmes with EU funds, check the criteria for the capital rebate, a write-off of part of the principal in advance, because they determine how much of the principal can be written off.
- For smaller amounts and for firms without enough collateral, HAMAG-BICRO offers loans and guarantees. See our guide HAMAG-BICRO loans 2026, the article on micro loans for growth and inclusion and a real-life comparison of HAMAG-BICRO, HBOR and a bank in HAMAG loan experience.
- Grants reduce the part of an investment that has to be financed with a loan or own money. The basics are in our guide EU grants for businesses in Croatia 2026, and we compared state aid in Croatia and the EU in a separate analysis.
- A combination of sources is often the cheapest. A grant reduces the amount to be financed, a favourable loan covers the rest and own funds remain available for working capital. Applications and deadlines need to be sequenced, because some programmes do not allow the investment to start before the application is submitted.
Methodology: data on sources of investment finance, use of external finance, bank finance, dissatisfaction with cost and finance constraints come from the EIB Investment Survey 2025 (Croatia overview, December 2025, and overview for Central, Eastern and South-Eastern Europe, January 2026). Some values were read from the report charts and checked against the figures given in the report text. Data on the use of grants, retained earnings, trade credit and equity and on reasons for not applying refer to SMEs and come from the SAFE 2025 analytical report (survey carried out from 27 August to 3 October 2025). The Croatian sample in that survey is small, so the differences are indicative. The number of SMEs comes from the SME Performance Review, SME Fact Sheet 2026 for Croatia (estimates for 2025), and the HBOR and HAMAG-BICRO figures from their annual reports. Loan rejection rates and interest rates for Croatia were not available in a verifiable form and are not shown. All differences and shares were recalculated and checked.
Frequently asked questions
How do Croatian SMEs finance investment?
Mostly with their own money. According to the 2025 EIB survey, SMEs finance 73% of investment value from own funds and 26% from external sources such as loans, leasing and grants. For all Croatian firms the split is 78 to 21%, in the EU 66 to 25%.
Is it harder to get credit in Croatia than in the EU?
Somewhat. 7.8% of Croatian firms are finance-constrained, against 6.1% in the EU, and the gap has narrowed from 6.7 to 1.7 points since 2021. Only 6% of Croatian firms are dissatisfied with the cost of finance, against 15% in the EU.
How many SMEs use grants and subsidised loans?
According to the 2025 SAFE survey, 12% of Croatian SMEs, against 7% in the EU. According to the EIB survey, 19% of investing Croatian firms received public support for investment, against 16% in the EU.
How much does HBOR lend to small and medium-sized enterprises?
In 2025 HBOR approved EUR 798 million to the private sector, of which 51%, about EUR 407 million, went to 1,015 placements to SMEs. In total it supported 1,654 projects with almost EUR 1.8 billion.
What is the difference between HBOR and HAMAG-BICRO?
HBOR is a development bank that lends directly and in cooperation with commercial banks, mostly for investment and exports. HAMAG-BICRO is an agency that provides loans and guarantees for bank loans, helping firms without enough collateral. In 2023 it approved 193 individual guarantees from the ESI Funds worth EUR 101.4 million.
Why do Croatian firms invest so much from their own money?
The EIB survey shows that 43% of investing firms use external finance (loans, leasing and grants), almost as many as in the EU (42%), but finance a smaller part of their investment with them. This points to smaller loans and to larger investments being postponed until own money has been accumulated. Fear of rejection as a reason for not applying for a credit line is cited by 1% of SMEs or fewer.

About the author
Matija Vlahovski, MSc in Economics
Co-founder and director of Omnia Solutions. He has more than ten years of experience in business financing, mostly with HAMAG-BICRO loans, HBOR loans, investment studies and tax incentives. He has taken part in more than 90 projects, through which clients were awarded more than EUR 12 million in grants and more than EUR 2 million in tax incentives. Before consulting, he worked at Privredna banka Zagreb, preparing loan proposals for small and medium-sized enterprises. He holds a HANFA licence.
Sources
- European Investment Bank, EIB Investment Survey 2025, Croatia overview and press release (9 December 2025)
- European Investment Bank, EIB Investment Survey 2025, overview for Central, Eastern and South-Eastern Europe (January 2026)
- European Commission and ECB, Survey on the access to finance of enterprises (SAFE) 2025, analytical report (2026)
- European Central Bank, SAFE for the first quarter of 2026 (27 April 2026)
- European Commission, SME Performance Review, 2026 SME Country Fact Sheet Croatia (June 2026)
- HBOR, Annual Report for 2025 (Croatian Parliament, June 2026, in Croatian)
- HAMAG-BICRO, Annual Report for 2023 (Croatian Parliament, in Croatian)
Planning an investment and looking for the best source?
Let us compare HBOR, HAMAG-BICRO, a bank and grants for your project
We will review your investment plan, calculate the total cost of financing by source and check which grants and programmes fit your project. The lending decision is made by the bank, HBOR or HAMAG-BICRO. The introductory call is free.