Updated on 30 October 2026. The text and charts are based on Eurostat data on exports by enterprise size for 2023, taken from the dataset updated on 8 October 2026. That update also contains data for 2024, according to which small and medium-sized enterprises generated 53.8% of goods exports (EU-27 35.0%), Croatia ranked fifth in the EU, and 8,613 enterprises exported goods, 257 of them large. On 27 October 2026 the Ministry of Economy announced that submissions for the Integrator call reopen on 17 November 2026 at 11:00.
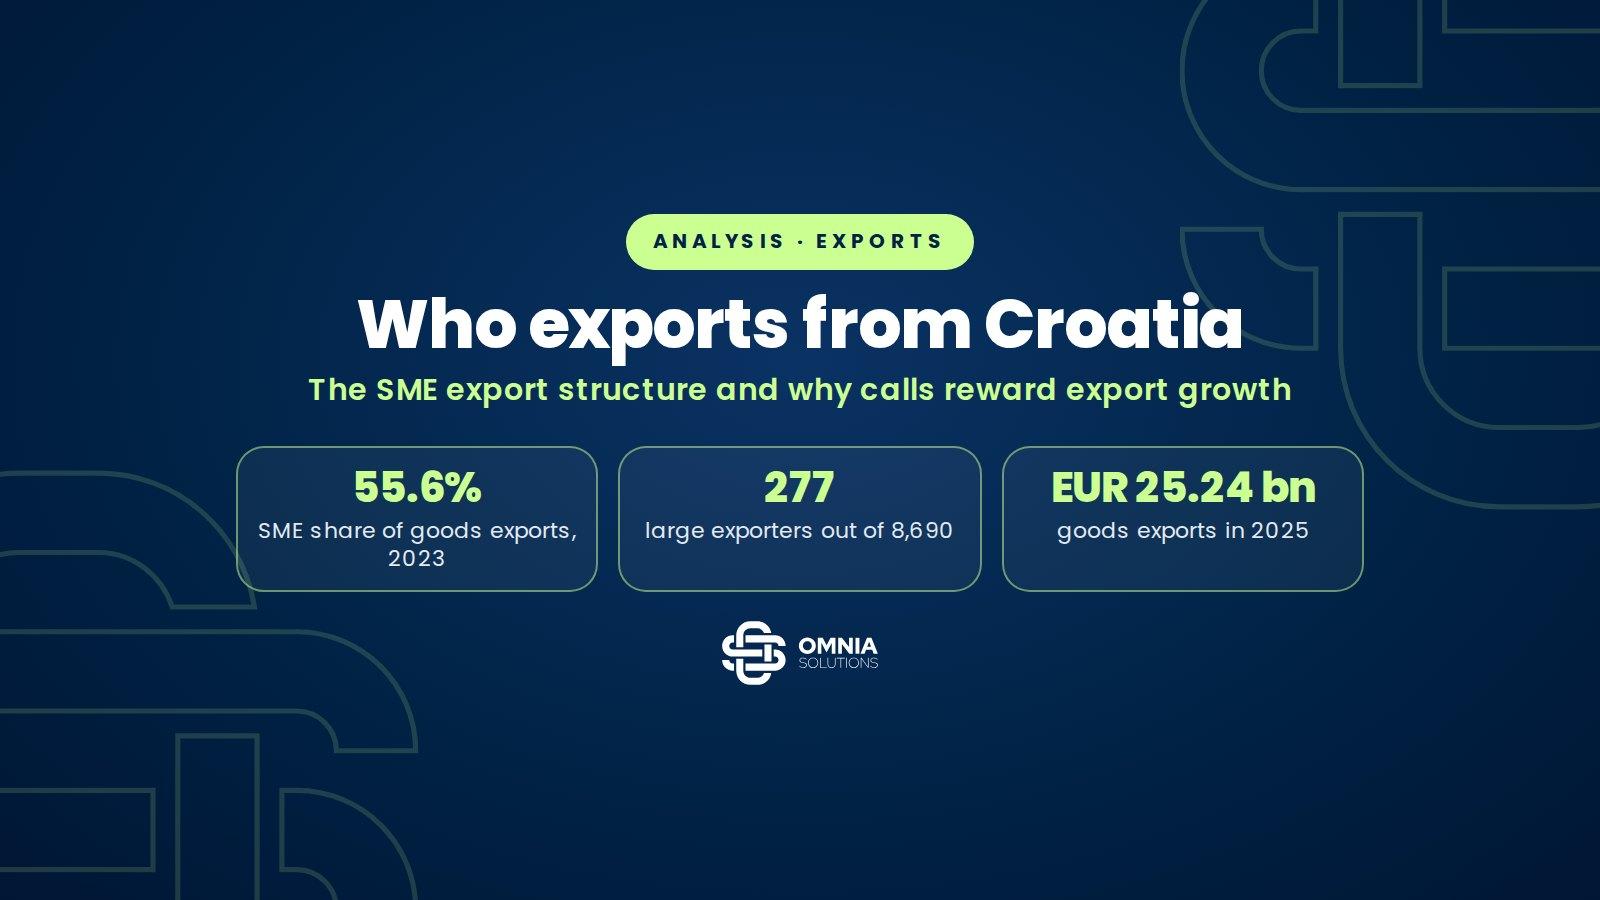
Small and medium-sized enterprises generated 55.6% of Croatia’s goods exports in 2023, the fourth highest share in the European Union, against an EU-27 average of 35.4%. The figure says less about the strength of Croatian SMEs and more about how few large exporters there are. In total 8,690 enterprises exported goods from Croatia, 277 of them large, and the average large exporter ships less than a third of what its EU counterpart does. Goods exports reached EUR 25.24 billion in 2025, 4.9% more than a year earlier, and half of that goes to five markets. Calls such as Integrator reward growth in export revenue because they measure what the economy lacks, more exporters and bigger ones. An export plan in an application therefore has to be feasible and verifiable, since delivery is later checked against the financial statements.
This analysis draws on Eurostat’s statistics on trade in goods by enterprise characteristics for 2023, on the Croatian Bureau of Statistics release on foreign trade in 2025 (published 29 May 2026) and on the European Commission’s SME Performance Review of June 2026. It shows who exports, how much and where to, how exports have developed since 2014 and why grant calls ask for export growth. It ends with a short guide to building an export plan that earns points rather than financial corrections.
In brief
- Small and medium-sized enterprises generated 55.6% of the value of Croatia’s goods exports in 2023. Croatia ranks fourth in the EU, behind Cyprus (89.0%), Estonia (78.3%) and Latvia (68.7%). The share is 20.1% in Germany, 35.7% in Slovenia and 35.4% in the EU as a whole.
- Goods were exported by 8,690 enterprises. Micro enterprises make up more than half of all exporters, while there are 277 large exporters, or 3.2%. Large enterprises generate 43.9% of exports in Croatia and 64.3% in the EU.
- The average large exporter in Croatia exports EUR 30.7 million a year, in the EU EUR 106.8 million. Small and micro exporters are close to their European peers.
- Foreign-controlled enterprises generated 51.3% of enterprise-linked goods exports in 2023.
- Goods exports came to EUR 25.24 billion in 2025, 2.4 times the 2014 level. Two thirds go to EU countries. Germany, Slovenia, Italy, Bosnia and Herzegovina and Serbia take 52.4% of exports.
- The Integrator call under the Competitiveness and Cohesion Programme scores the planned growth of export and sales revenue after project completion under the value-for-money criterion. Target values go into the grant agreement and are checked against annual financial statements.
Sources: 11, listed at the end · How we check our information · Report an error
Key figures
Goods exports from Croatia: who, how much and where to
Sources: Eurostat, ext_tec01 and ext_tec07 (2023); Croatian Bureau of Statistics (DZS), foreign trade in goods 2025 (29 May 2026). Calculation: Omnia Solutions.
How large is the SME share of Croatian exports
Every year Eurostat links customs and Intrastat records to the business register and so assigns each export to an enterprise and its size class. For Croatia, EUR 19.40 billion of goods exports was allocated this way in 2023, or 84.0% of total exports of EUR 23.09 billion. The rest consists of shipments below the Intrastat threshold and trade that cannot be linked to an enterprise. The shares in this section refer to the allocated part.
Micro enterprises with up to nine employees generated 9.9% of export value, small enterprises 20.9%, medium-sized ones 24.8% and large ones 43.9%. Enterprises of unknown size account for 0.5%. Together, small and medium-sized enterprises generate 55.6% of exports. In the EU the picture is reversed. Large enterprises generate 64.3% of goods exports and SMEs 35.4%. Eurostat’s overview with 2022 data put the figure at 37%.
The ranking of member states is indicative of economic structure rather than entrepreneurial activity. At the top are Cyprus, Estonia and Latvia, with the Netherlands just behind Croatia, economies without large industrial exporters or with a strong trading role. At the bottom are Germany (20.1%), Ireland (21.0%) and France (23.2%), where exports are concentrated in large pharmaceutical, automotive and aerospace companies. Slovenia, with its large pharmaceutical and automotive industries, is at 35.7%.
Interactive chart
EU member states: share of enterprises by size in the value of goods exports, 2023
Cyprus
Estonia
Latvia
Croatia
Netherlands
Italy
Lithuania
Portugal
Bulgaria
Denmark
Spain
Austria
Greece
Belgium
Luxembourg
Malta
Slovenia
EU-27 total
Poland
Sweden
Finland
Czechia
Slovakia
Hungary
Romania
France
Ireland
Germany
SMEs = enterprises with up to 249 employees. Croatia ranks fourth with 55.6%, behind Cyprus, Estonia and Latvia. The EU-27 figure, weighted by export value, is 35.4%; the median member state is at 39.6%.
Show the data in a table
| Country | SMEs total | Micro (0–9) | Small (10–49) | Medium (50–249) | Large (250+) |
|---|---|---|---|---|---|
| Cyprus | 89.0% | 34.8% | 15.1% | 39.1% | 10.1% |
| Estonia | 78.3% | 18.4% | 21.7% | 38.2% | 21.7% |
| Latvia | 68.7% | 15.8% | 23.6% | 29.4% | 30.3% |
| Croatia | 55.6% | 9.9% | 20.9% | 24.8% | 43.9% |
| Netherlands | 54.6% | 11.3% | 14.8% | 28.5% | 45.4% |
| Italy | 51.5% | 5.4% | 15.5% | 30.6% | 48.5% |
| Lithuania | 50.9% | 13.1% | 15.0% | 22.7% | 49.1% |
| Portugal | 50.2% | 9.3% | 13.2% | 27.7% | 49.8% |
| Bulgaria | 47.7% | 11.0% | 14.0% | 22.7% | 52.3% |
| Denmark | 43.7% | 5.6% | 13.3% | 24.8% | 50.5% |
| Spain | 42.4% | 9.6% | 11.4% | 21.3% | 57.6% |
| Austria | 41.9% | 18.6% | 7.5% | 15.8% | 58.1% |
| Greece | 41.2% | 8.7% | 12.2% | 20.3% | 58.7% |
| Belgium | 39.6% | 8.1% | 11.4% | 20.1% | 60.4% |
| Luxembourg | 38.8% | 6.5% | 8.5% | 23.9% | 38.4% |
| Malta | 38.5% | 12.2% | 6.9% | 19.4% | 61.5% |
| Slovenia | 35.7% | 8.8% | 10.4% | 16.5% | 64.3% |
| EU-27 total | 35.4% | 7.2% | 9.5% | 18.8% | 64.3% |
| Poland | 34.5% | 7.0% | 8.7% | 18.8% | 65.4% |
| Sweden | 33.9% | 14.8% | 6.2% | 12.9% | 66.1% |
| Finland | 32.9% | 3.4% | 6.5% | 23.1% | 66.7% |
| Czechia | 32.0% | 3.8% | 7.8% | 20.4% | 66.5% |
| Slovakia | 28.9% | 6.9% | 7.0% | 15.1% | 70.5% |
| Hungary | 28.2% | 4.8% | 8.3% | 15.1% | 70.9% |
| Romania | 25.9% | 5.0% | 7.6% | 13.3% | 74.1% |
| France | 23.2% | 4.9% | 6.5% | 11.7% | 76.8% |
| Ireland | 21.0% | 6.3% | 4.4% | 10.3% | 79.0% |
| Germany | 20.1% | 3.3% | 5.3% | 11.5% | 79.9% |
Source: Eurostat, trade in goods by enterprise characteristics (ext_tec01), 2023. Exports to all countries, all activities, dataset updated 8 October 2026. Calculation and ranking: Omnia Solutions.
Who the Croatian exporters are
In 2023, 8,690 enterprises exported goods from Croatia. Among them were 4,636 micro enterprises (53.3%), 2,603 small (30.0%), 921 medium-sized (10.6%) and 277 large (3.2%), while the size of 253 enterprises is unknown. Small and medium-sized enterprises together make up 93.9% of exporters, in the EU 96.9%. According to Eurostat’s structural business statistics, 240,260 SMEs were active in industry, construction and market services in 2023, so about 3.4% of them export goods. Of 436 large enterprises, 277 exported goods that year. According to the European Commission’s review of June 2026, SMEs generate 64.0% of value added in Croatia’s business sector, so their share of goods exports is smaller than their share of the economy.
The difference from the EU shows in the average size of exporters. A large enterprise in Croatia exports EUR 30.7 million a year on average, in the EU EUR 106.8 million. A medium-sized enterprise exports EUR 5.2 million against EUR 10.0 million in the EU. A small enterprise exports EUR 1.6 million, as in the EU, and a micro enterprise EUR 0.41 million against EUR 0.39 million in the EU. The high SME share of Croatian exports is therefore a consequence of the small number and small size of large exporters, not of above-average export strength among small firms.
Two further figures complete the picture. Foreign-controlled enterprises generated 51.3% of enterprise-linked goods exports and domestically controlled ones 44.4%. Almost all exports, 94.7%, come from enterprises that also import goods, so involvement in supply chains is the rule rather than the exception. This is exactly what the Integrator call targets, by financing the entry of SME consortia into the value chains of larger companies.
Interactive chart
Croatia and EU-27: who the exporters are and how much they export, 2023
Micro (0 to 9 employees)
Small (10 to 49)
Medium (50 to 249)
Large (250 or more)
Micro (0 to 9 employees)
Small (10 to 49)
Medium (50 to 249)
Large (250 or more)
In 2023, 8,690 enterprises exported goods from Croatia and 1.51 million from the EU. Enterprises of unknown size (2.9% of exporters in Croatia, 0.9% in the EU) are not shown.
Source: Eurostat, trade in goods by enterprise characteristics (ext_tec01), 2023. Calculation: Omnia Solutions.
Where Croatia exports to
According to final DZS data, goods exports amounted to EUR 25.24 billion in 2025, up 4.9%. Imports came to EUR 45.23 billion, so exports cover 55.8% of imports and the trade deficit reached EUR 19.99 billion. EUR 16.79 billion, or 66.5% of exports, went to EU member states.
Germany is the first market with EUR 3.20 billion (12.7% of exports), followed by Slovenia with EUR 2.99 billion (11.8%), Italy with EUR 2.92 billion (11.6%), Bosnia and Herzegovina with EUR 2.72 billion (10.8%) and Serbia with EUR 1.39 billion (5.5%). These five markets take 52.4% of exports and the top ten 69.7%. Exports to Slovenia grew by 13.6% and to Germany by 11.5%. Exports to Hungary fell by 21.3% and to the United States by 19.2%, which shows how volatile individual markets can be within a single year. Machinery and transport equipment make up 25.3% of exports and manufacturing 86.1%.
Interactive chart
Croatia’s top ten export markets in 2025
Germany
Slovenia
Italy
Bosnia and Herzegovina
Serbia
Austria
Hungary
United States
Slovakia
France
Germany
Slovenia
Italy
Bosnia and Herzegovina
Serbia
Austria
Hungary
United States
Slovakia
France
The five largest markets take 52.4% of goods exports, the top ten 69.7%. Exports to Germany exceeded three billion euro for the first time.
Show the data in a table
| Market | Exports in 2025 | Change on 2024 |
|---|---|---|
| Germany | EUR 3,199 m | +11.5% |
| Slovenia | EUR 2,990 m | +13.6% |
| Italy | EUR 2,924 m | +6.6% |
| Bosnia and Herzegovina | EUR 2,720 m | +0.9% |
| Serbia | EUR 1,395 m | +7.4% |
| Austria | EUR 1,263 m | +3.7% |
| Hungary | EUR 1,169 m | −21.3% |
| United States | EUR 650 m | −19.2% |
| Slovakia | EUR 642 m | +12.2% |
| France | EUR 635 m | +11.6% |
Source: Croatian Bureau of Statistics (DZS), First Release VT-2026-1-2, foreign trade in goods of the Republic of Croatia 2025 (29 May 2026), final data. Calculation: Omnia Solutions.
How goods exports have developed since 2014
Goods exports rose from EUR 10.43 billion in 2014 to EUR 25.24 billion in 2025, 2.4 times over. The biggest jump came in 2022, when exports grew by 31.1%, partly because of higher energy and raw material prices, and in 2023 they fell by 4.9%. Growth then returned to a moderate 4.2% in 2024 and 4.9% in 2025. The share of EU countries in exports has moved between 62% and 68% and stood at 66.5% in 2025. Exports outside the EU more than doubled, from EUR 3.96 billion to EUR 8.46 billion.
Interactive chart
Croatia’s goods exports 2014–2025, EUR billion
Show the data in a table
| Year | Total | To EU countries | Outside the EU |
|---|---|---|---|
| 2014 | 10.4 bn | 6.5 bn | 4.0 bn |
| 2015 | 11.7 bn | 7.5 bn | 4.2 bn |
| 2016 | 12.5 bn | 8.0 bn | 4.5 bn |
| 2017 | 14.2 bn | 8.9 bn | 5.3 bn |
| 2018 | 14.8 bn | 9.8 bn | 5.0 bn |
| 2019 | 15.3 bn | 10.2 bn | 5.2 bn |
| 2020 | 15.0 bn | 10.1 bn | 4.9 bn |
| 2021 | 18.5 bn | 12.5 bn | 6.0 bn |
| 2022 | 24.3 bn | 16.6 bn | 7.7 bn |
| 2023 | 23.1 bn | 15.6 bn | 7.5 bn |
| 2024 | 24.1 bn | 15.7 bn | 8.3 bn |
| 2025 | 25.2 bn | 16.8 bn | 8.5 bn |
Current prices. The jump in 2022 partly reflects higher energy and raw material prices. Hover over or tap the chart.
Source: Eurostat, ext_lt_intratrd; 2024 and 2025 figures match the DZS. Calculation: Omnia Solutions.
Why calls reward export growth
The selection criteria for SME calls under the Competitiveness and Cohesion Programme were approved by the Monitoring Committee in October 2024. For the Integrator call, the mandatory value-for-money criterion is measured, among other things, by the increase in export revenue and the increase in sales revenue from products or services after project completion, with exports to EU countries counting as exports. In Annex 3 to the call (Award procedure) these are sub-criteria 1.4 (exports) and 1.5 (sales), and the whole criterion carries 26 of 100 points with a threshold of 14. The 2025 internationalisation call had the explicit purpose of raising the SME share of total exports of goods and services.
There are two reasons. First, EU grants must have an effect beyond the company itself, and exports are the simplest proof that a product is competitive outside the home market. Second, revenue from sales abroad is a separate line in the annual financial statement (GFI-POD), so the plan can be verified without special studies. Evaluators get a measurable and comparable indicator, and the programme authorities get an indicator to report to the Commission.
The points come with obligations. In the draft Guidelines for Integrator, the indicator “increased sales revenue” has its baseline in the year before the application and its target three years after project completion. If less than 80% of the target is achieved, a financial correction of 10% of the grant follows; below 60% the correction is 20% and below 40% it is 30%. The final Guidelines may differ. An export plan written for points rather than for the market can therefore end up costing more than it brings in.
How to build a realistic export plan
- The baseline comes from the annual financial statement for the year before the application, from the line for revenue from sales abroad, split into EU and third countries. That figure must agree with Intrastat and customs data, because the same sources are used later for verification.
- Growth is tied to specific customers and markets. A letter of intent from the integrator or a customer, existing contracts and enquiries count for more than sector estimates. For every amount listed it should be clear who buys what, and at what price.
- Growth must be consistent with capacity after the investment. If a new line raises output by 30%, an export plan that grows by 80% needs an explanation of where the rest comes from.
- The market provides the benchmark. Total goods exports grew by 4.9% in 2025, exports to Germany by 11.5%, while exports to Hungary fell by 21.3%. A plan that outpaces market growth several times over must rest on a new product or a new customer, not on the trend.
- The timeline follows implementation. An Integrator project lasts at most 36 months and targets are measured in the years after completion, so the plan should show a gradual increase rather than a jump in the first year.
- The target value must be ambitious enough to earn points and cautious enough to reach at least 80%. That range is decided within the company, before the application.
- The export plan must be consistent with the rest of the application, with headcount, revenue projections, cash flow and the financing of the own contribution. If part of the investment is financed with a loan, the HBOR loan calculator helps compare the cost of HBOR and a bank before the figures are locked in.
What this means for businesses
- The Integrator call is aimed at consortia of at least three small and medium-sized enterprises entering the supply chain of a medium-sized or large integrator, with grants of EUR 300,000 to 820,000. Submissions were suspended on 3 July 2026 because the aid requested exceeded the funds available. The time until the reopening is best used for the export plan and letters of intent.
- The Process innovation in S3 areas call finances investment in production processes in manufacturing, which accounts for 86% of Croatia’s goods exports, so export growth is a natural indicator of impact there too.
- An overview of all open and announced calls is in our guide EU grants for businesses in Croatia 2026 and in our overview of business incentives in Croatia 2026.
- Most of the money in the current programming period has already been committed, as our analysis of EU funds absorption shows. Calls that reopen and open-ended calls reward those with documents ready.
- Markets such as Hungary and the United States fell by a fifth in a single year, while exports to Germany and Slovenia grew at double-digit rates. An export plan with several markets and several customers carries less indicator risk than reliance on a single buyer.
Methodology: shares by enterprise size come from Eurostat dataset ext_tec01 (exports to all countries, all activities, 2023), which covers exports linked to enterprises in the business register, in Croatia 84.0% of total goods exports. SMEs are enterprises with up to 249 employees; the “unknown” class is included neither in SMEs nor in large enterprises. The EU-27 share is weighted by export value. Ownership comes from dataset ext_tec07 and two-way traders from ext_tec06, both for 2023. Total exports, markets and products for 2024 and 2025 come from DZS First Release VT-2026-1-2 (final data), and the time series from 2014 from Eurostat dataset ext_lt_intratrd, which matches the DZS for 2024 and 2025. The number of enterprises by size comes from Eurostat’s structural business statistics (sbs_sc_ovw, 2023), and the SME share of value added from the European Commission’s SME Fact Sheet 2026 (estimate for 2025). All percentages and ranks were calculated from exact amounts, and class totals were checked against the overall totals.
Frequently asked questions
What share of Croatian exports comes from small and medium-sized enterprises?
According to Eurostat, small and medium-sized enterprises generated 55.6% of the value of Croatia’s goods exports in 2023 and large enterprises 43.9%. In the EU as a whole, SMEs generate 35.4% of exports. Croatia ranks fourth of 27 member states on the SME share.
How many enterprises in Croatia export goods?
In 2023, 8,690 enterprises exported goods, including 4,636 micro, 2,603 small, 921 medium-sized and 277 large enterprises, while the size of 253 is unknown. Of about 240,000 SMEs in industry, construction and market services, about 3.4% export goods.
What are Croatia’s largest export markets?
In 2025 they were Germany (EUR 3.20 billion, 12.7% of exports), Slovenia (EUR 2.99 billion), Italy (EUR 2.92 billion), Bosnia and Herzegovina (EUR 2.72 billion) and Serbia (EUR 1.39 billion). These five markets take 52.4% of goods exports, and EU countries 66.5% in total.
Why does the Integrator call reward export growth?
The value-for-money criterion in the Integrator call is measured, among other things, by the planned increase in export revenue and sales revenue after project completion. Exports are measurable proof that the grant has an effect beyond the company, and revenue from sales abroad is verified from the annual financial statement. The criterion carries 26 of 100 points, with a threshold of 14.
What happens if the planned export growth is not achieved?
Indicator targets form part of the grant agreement. Under the draft Guidelines for Integrator, achievement of 80% or more has no consequences, 60 to 80% brings a correction of 10% of the grant, 40 to 60% a correction of 20% and below 40% a correction of 30%. The final Guidelines may differ, so they should be checked before applying.
How do you build a realistic export plan for an application?
The baseline is taken from the financial statement for the year before the application. Growth is tied to specific customers, letters of intent and capacity after the investment, compared with market trends and spread gradually over the years after project completion. The plan must be consistent with the revenue, headcount and cash flow projections in the rest of the application.

About the author
Davor Nikolić, MSc in Political Science
Co-founder and director of Omnia Solutions. He prepares and implements projects co-financed by EU and national funds, mainly in innovation, entrepreneurship and industry. From 2012 to 2014 he was an advisor in the Cabinet of the Minister of Entrepreneurship and Crafts, and from 2014 to 2018 a senior expert advisor for the implementation, evaluation and contracting of EU business projects at the Ministry of Economy, Entrepreneurship and Crafts. As a project manager, he has worked on the preparation and implementation of European and international projects with a total value of more than EUR 60 million. Since 2025 he has been an external member of the European Affairs Committee of the Croatian Parliament. He is a doctoral candidate in International Relations at the Faculty of Social Sciences, University of Ljubljana.
Sources
- Eurostat, Trade by NACE Rev. 2 activity and enterprise size class (ext_tec01), updated 8 October 2026
- Eurostat, Trade by type of ownership (ext_tec07) and Trade by type of trader (ext_tec06)
- Eurostat, Intra and Extra-EU trade by Member State and by product group (ext_lt_intratrd)
- Eurostat, Statistics Explained: International trade in goods by enterprise size
- Eurostat, Enterprise statistics by size class and NACE Rev. 2 activity (sbs_sc_ovw)
- Croatian Bureau of Statistics, First Release VT-2026-1-2, Foreign trade in goods of the Republic of Croatia, 2025 (29 May 2026, in Croatian)
- European Commission, SME Performance Review, Annual Report on European SMEs 2025/2026 and SME Fact Sheet 2026 for Croatia (22 June 2026)
- eufondovi.gov.hr, Integrator call (PK.1.3.08) published (in Croatian)
- Monitoring Committee of the Competitiveness and Cohesion Programme, selection criteria and methodologies for specific objective RSO 1.3 (in Croatian)
- e-Savjetovanja, draft Guidelines for Applicants for the Integrator call (February 2025, in Croatian)
Preparing an application with an export plan?
Let us check the baselines, the targets and what earns points without the risk of corrections
We will review your export data, capacity after the investment and the call conditions, and propose indicators you can defend. The introductory call is free.