Updated on 30 October 2026. The 2026 edition of the scoreboard, published on 9 July 2026, moved Croatia back to the emerging innovators at 69.2% of the EU average (rank 22). Updated figures are marked in the text and in the chart by edition.
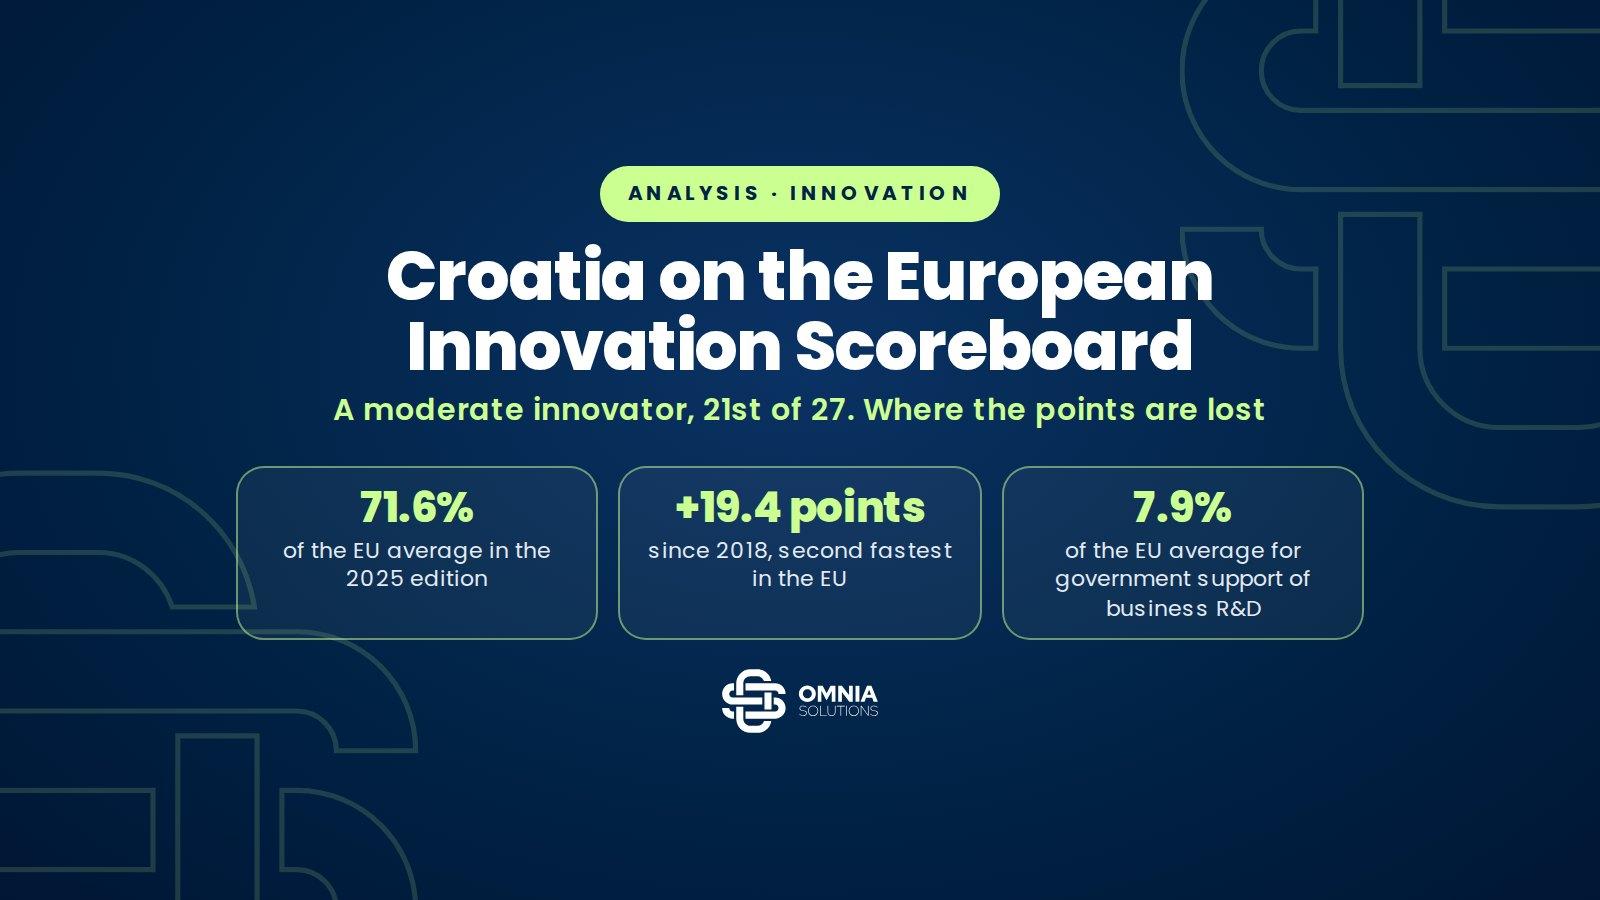
The European Innovation Scoreboard, published every year by the European Commission, placed Croatia among the moderate innovators in its 2025 edition. Croatia’s summary index stands at 71.6% of the EU average, 21st of 27 member states and only 1.6 points above the 70% threshold below which countries count as emerging innovators. Since 2018 the index has risen by 19.4 points, the second fastest growth in the Union, but it fell by 1.0 point in the last year. Only one of the 12 indicator dimensions is above the EU average. Croatia loses most points on government support of business R&D, knowledge-intensive services exports, intellectual property and labour productivity.
The analysis is based on the 2025 edition, published on 15 July 2025, on the profiles of Croatia and the other member states and on Eurostat data. It explains what the scoreboard measures, where Croatia stands against other member states, on which indicators it lags, what depends on businesses and what on the state, and what follows for companies planning investments.
In brief
- Croatia stands at 71.6% of the EU average and ranks 21st. Greece (75.8%) is just ahead and Hungary (69.5%) just behind; Hungary dropped out of the moderate group in the same year.
- Only Estonia (+30.0) grew faster than Croatia’s 19.4 points since 2018. The EU average rose by 12.6 points, so the gap narrowed from 38.8 to 32.0 points.
- Croatia is above the EU average only on linkages (106.4%). The weakest dimensions are trade impacts (46.0%), attractive research systems (47.5%) and intellectual assets (50.2%).
- The lowest single indicator is government support of business R&D, at 7.9% of the EU average. Businesses invested 0.80% of GDP in R&D in 2024, against 1.50% in the EU.
- The label depends on the threshold as much as on performance. In the 2023 and 2024 editions Croatia sat just below 70% (69.6%), and in the 2026 edition (updated) it fell below again, to 69.2%.
- The scoreboard rewards what funding calls finance, namely business R&D, product and process innovation, cooperation with research institutions and protection of intellectual property.
Sources: 11, listed at the end · How we check our information · Report an error
Key figures
Croatia on the European Innovation Scoreboard 2025
Source: European Commission, European Innovation Scoreboard 2025, Croatia and member state profiles (15 July 2025); EIS 2026 (9 July 2026); Eurostat, rd_e_gerdtot.
What the scoreboard measures and what “moderate innovator” means
The 2025 edition is the first after a methodological revision and covers 32 indicators in 12 dimensions and four pillars, namely framework conditions (human resources, research systems, digitalisation), investments (finance and support, firm investments, information technologies), innovation activities (innovators, linkages, intellectual assets) and impacts (sales and employment, trade, productivity). Each indicator is rescaled from 0 to 1 using the lowest and highest values across all countries from 2018 to 2025, and the summary index is their unweighted average.
Countries are grouped by comparing their index with the EU average of the same year. Innovation leaders are above 125%, strong innovators between 100 and 125%, moderate innovators between 70 and 100% and emerging innovators below 70%. “Moderate innovator” therefore means only that the index is between 70 and 100% of the average. Croatia is last in that group, whose average is 85.9%.
The thresholds have changed. In the 2020 edition the lowest group was the modest innovators, below 50% of the average, and Croatia was a moderate innovator together with Poland, Slovakia and Hungary. The 2021 revision replaced the modest group with the emerging innovators, and Croatia was in that group in the 2022, 2023 and 2024 editions. The Commission warns that results from different editions must not be compared directly, because data and methodology are revised.
How Croatia compares with other member states
At 71.6% of the EU average Croatia ranks 21st of 27 member states and 25th when neighbouring European countries are included. Greece (75.8%), Czechia (80.6%) and Lithuania (81.0%) are ahead; Hungary (69.5%), Poland (65.9%), Slovakia (62.6%), Latvia (56.7%), Bulgaria (45.8%) and Romania (37.7%) are behind. Slovenia ranks 13th with 94.7%. Sweden (138.1%), Denmark (135.0%), the Netherlands (129.1%) and Finland (125.3%) lead. The median member state is at 93.0%, so Croatia is 21.4 points below the middle of the Union.
The trend is more favourable. In the 2025 edition’s series Croatia’s index stood at 61.2% of the then EU average in 2018. Its growth of 19.4 points is the second highest in the Union, while the EU average rose by 12.6 points. From 2024 to 2025 Croatia’s index fell by 1.0 point and the EU average by 0.4 points, with 14 member states declining.
Interactive chart
EU member states on the European Innovation Scoreboard 2025
Sweden
Denmark
Netherlands
Finland
Ireland
Belgium
Luxembourg
Austria
Germany
France
Estonia
EU average
Malta
Slovenia
Italy
Spain
Portugal
Cyprus
Lithuania
Czechia
Greece
Croatia
Hungary
Poland
Slovakia
Latvia
Bulgaria
Romania
Summary Innovation Index relative to the EU average in 2025. Innovation leaders are above 125%, strong innovators at 100 to 125%, moderate innovators at 70 to 100% and emerging innovators below 70%. With 71.6% Croatia ranks 21st of 27.
Show the data in a table
| Country | Index 2025, % of EU average | Change since 2018, points |
|---|---|---|
| Sweden | 138.1% | +12.9 |
| Denmark | 135.0% | +12.3 |
| Netherlands | 129.1% | +11.0 |
| Finland | 125.3% | +8.9 |
| Ireland | 123.1% | +13.3 |
| Belgium | 122.6% | +11.7 |
| Luxembourg | 114.5% | +0.9 |
| Austria | 114.0% | +8.2 |
| Germany | 111.1% | +8.7 |
| France | 108.6% | +7.4 |
| Estonia | 104.8% | +30.0 |
| EU average | 100.0% | +12.6 |
| Malta | 95.0% | +16.7 |
| Slovenia | 94.7% | +16.8 |
| Italy | 93.0% | +15.4 |
| Spain | 92.7% | +13.9 |
| Portugal | 90.7% | +9.0 |
| Cyprus | 84.1% | +17.6 |
| Lithuania | 81.0% | +17.4 |
| Czechia | 80.6% | +16.3 |
| Greece | 75.8% | +15.3 |
| Croatia | 71.6% | +19.4 |
| Hungary | 69.5% | +16.2 |
| Poland | 65.9% | +18.0 |
| Slovakia | 62.6% | +8.3 |
| Latvia | 56.7% | +4.9 |
| Bulgaria | 45.8% | +6.3 |
| Romania | 37.7% | +8.2 |
Source: European Commission, European Innovation Scoreboard 2025, profiles of the 27 member states (headline values, rank and changes). Ranking: Omnia Solutions.
Growth since 2018 was carried by three indicators with large jumps, venture capital (+190.4 points), cloud computing (+184.2) and innovation expenditure per person employed (+84.4). The fall in the last year came from venture capital (−91.3), the share of SMEs with product innovations (−81.5) and employment in innovative enterprises (−50.6). In a small economy venture capital is volatile, because a few transactions move it by tens of points.
Where Croatia loses points
Croatia is above the EU average only on linkages (106.4%), thanks to public-private co-publications (146.3%) and job-to-job mobility of skilled staff (102.1%). Use of information technologies is at 99.7%, with cloud computing at 99.4% and ICT specialists at 100.0%. All other dimensions are below average.
The biggest gap is in trade impacts (46.0%, rank 26). Knowledge-intensive services exports are at 12.7% of the EU average and last in the Union, and medium and high-tech exports at 49.6%. Next come attractive research systems (47.5%), with the most cited publications at 35.8% and foreign doctorate students at 33.9%, and intellectual assets (50.2%, rank 26), with design applications at 30.4%, PCT patent applications at 45.6% and trademarks at 75.8%. Human resources are at 70.1%, mainly because of lifelong learning (46.9%).
Interactive chart
Croatia compared with the EU average: gap in points
Human resources
Attractive research systems
Digitalisation
Finance and support
Firm investments
Use of information technologies
Innovators
Linkages
Intellectual assets
Sales and employment impacts
Trade impacts
Resource and labour productivity
Business R&D expenditure
Non-R&D innovation expenditure
Innovation expenditure per person employed
Cloud computing
Employed ICT specialists
SMEs with product innovations
SMEs with process innovations
Innovative SMEs collaborating
PCT patent applications
Trademark applications
Design applications
Sales of innovations
Employment in innovative enterprises
Medium and high-tech exports
Knowledge-intensive services exports
High-tech imports from outside the EU
New doctorate graduates
Population with tertiary education
Lifelong learning
International scientific co-publications
Publications among top 10% most cited
Foreign doctorate students
High-speed internet access
Above basic digital skills
Public sector R&D expenditure
Venture capital
Government support of business R&D
Public-private co-publications
Job-to-job mobility of HRST
Resource productivity
Production-based CO2 productivity
Labour productivity
Zero is the EU average in 2025. Croatia is above average only on linkages (106.4%) and furthest below on trade impacts (46.0%), attractive research systems (47.5%) and intellectual assets (50.2%).
Show the data in a table
| Indicator | % of EU average 2025 | Rank in EU | Change 2018–2025 | Change 2024–2025 |
|---|---|---|---|---|
| Human resources | 70.1% | 23 | +14.7 | +11.8 |
| Attractive research systems | 47.5% | 23 | +13.5 | +0.5 |
| Digitalisation | 84.9% | 20 | +20.2 | −6.3 |
| Finance and support | 73.9% | 14 | +51.7 | −18.5 |
| Firm investments | 79.3% | 13 | +19.1 | +35.5 |
| Use of information technologies | 99.7% | 15 | +79.4 | +28.7 |
| Innovators | 79.1% | 19 | −7.8 | −60.1 |
| Linkages | 106.4% | 15 | +47.8 | −1.8 |
| Intellectual assets | 50.2% | 26 | +9.7 | −1.0 |
| Sales and employment impacts | 79.6% | 18 | +6.5 | −27.0 |
| Trade impacts | 46.0% | 26 | −1.3 | −0.9 |
| Resource and labour productivity | 74.5% | 15 | +26.5 | +7.5 |
| New doctorate graduates | 86.9% | 16 | +11.6 | +23.1 |
| Population with tertiary education | 73.4% | 21 | +21.2 | +4.0 |
| Lifelong learning | 46.9% | 25 | +12.5 | +1.9 |
| International scientific co-publications | 80.2% | 19 | +45.6 | +6.2 |
| Publications among top 10% most cited | 35.8% | 26 | +7.7 | −2.4 |
| Foreign doctorate students | 33.9% | 23 | −3.8 | +1.4 |
| High-speed internet access | 81.4% | 23 | +80.7 | +20.7 |
| Above basic digital skills | 90.0% | 17 | −27.5 | −27.5 |
| Public sector R&D expenditure | 85.0% | 13 | +28.8 | −3.4 |
| Venture capital | 150.6% | 6 | +190.4 | −91.3 |
| Government support of business R&D | 7.9% | 24 | +7.6 | +0.1 |
| Business R&D expenditure | 49.7% | 17 | +27.6 | −0.7 |
| Non-R&D innovation expenditure | 80.2% | 13 | −66.2 | +3.4 |
| Innovation expenditure per person employed | 107.4% | 9 | +84.4 | +99.9 |
| Cloud computing | 99.4% | 15 | +184.2 | +48.6 |
| Employed ICT specialists | 100.0% | 14 | +38.1 | +20.5 |
| SMEs with product innovations | 68.9% | 19 | −4.7 | −81.5 |
| SMEs with process innovations | 87.1% | 19 | −10.9 | −39.4 |
| Innovative SMEs collaborating | 91.6% | 15 | +20.3 | −10.6 |
| Public-private co-publications | 146.3% | 17 | +55.1 | −20.9 |
| Job-to-job mobility of HRST | 102.1% | 14 | +67.6 | +14.7 |
| PCT patent applications | 45.6% | 22 | +4.1 | +1.3 |
| Trademark applications | 75.8% | 23 | +27.1 | +0.8 |
| Design applications | 30.4% | 23 | +3.3 | −4.9 |
| Sales of innovations | 102.1% | 13 | +38.5 | −2.5 |
| Employment in innovative enterprises | 59.9% | 20 | −24.6 | −50.6 |
| Medium and high-tech exports | 49.6% | 22 | −3.1 | 0.0 |
| Knowledge-intensive services exports | 12.7% | 27 | +5.6 | +1.2 |
| High-tech imports from outside the EU | 73.5% | 12 | −5.6 | −3.6 |
| Resource productivity | 83.3% | 13 | +34.3 | +12.6 |
| Production-based CO2 productivity | 94.7% | 16 | +42.3 | +9.4 |
| Labour productivity | 31.0% | 23 | +2.3 | −0.7 |
Source: European Commission, European Innovation Scoreboard 2025, Croatia profile, values relative to EU 2025 = 100. Split into indicators driven by firms and by the state: Omnia Solutions.
The finance and support dimension (73.9%) hides two extremes. Venture capital is at 150.6% of the average and sixth in the Union, while government support of business R&D, which covers direct funding and tax incentives, is at 7.9% and ranks 24th. Within firm investments (79.3%), business R&D expenditure is at 49.7% and innovation expenditure per person employed at 107.4%. This suggests that Croatian firms spend relatively more of their innovation budgets on equipment, licences and ready-made solutions than on their own research.
What depends on businesses and what on the state
Splitting the indicators into those determined by firms and those shaped by the state and the system is not official, but it helps the reading. On the business side the range is huge, from 12.7% for knowledge-intensive services exports to 107.4% for innovation expenditure per person employed. According to Eurostat, the business sector invested 0.80% of GDP in R&D in 2024, against 1.50% in the EU. In 2018 it was 0.45%, so the share has almost doubled but is still at 53% of the EU level. More in our analysis of R&D spending.
On the side of the state and the system the weakest are government support of business R&D (7.9%), labour productivity (31.0%), foreign doctorate students (33.9%), the most cited publications (35.8%) and lifelong learning (46.9%). The structural indicators in the profile confirm this. In manufacturing, the share of employment in high and medium-high technology activities is 20.7%, against 38.1% in the EU, and Horizon Europe funding intensity per researcher is at 73% of the EU level. The Commission lists the World Bank-financed DIGIT project, HAMAG-BICRO programmes and the Digital Croatia Strategy 2032 among the programmes supporting Croatia’s progress. Participation in Horizon Europe is covered in a separate analysis.
How Croatia moved across scoreboard editions
Croatia’s headline figure was 66.5% of the EU average in the 2022 edition, 69.6% in both the 2023 and 2024 editions and 71.6% in the 2025 edition. These figures are not directly comparable, but they show how close Croatia is to the group boundary and how much the label depends on a few indicators.
Interactive chart
Croatia by scoreboard edition: share of the EU average
Show the data in a table
| Edition | Croatia, % of EU average |
|---|---|
| 2022 | 66.5% |
| 2023 | 69.6% |
| 2024 | 69.6% |
| 2025 | 71.6% |
| 2026 | 69.2% |
Each edition is calculated separately with revised data and methodology, so the Commission warns that values from different editions are not directly comparable. The chart shows the headline figure each edition published for Croatia. The 2026 edition (69.2%) was published on 9 July 2026 and was added in the update.
Source: European Commission, European Innovation Scoreboard 2025 and Croatia profiles in the 2022, 2023, 2024 and 2026 editions. Group thresholds from the EIS 2025 methodology report.
Updated. The 2026 edition, published on 9 July 2026, put Croatia at 69.2% of the EU average and 22nd place, making it an emerging innovator again, while Hungary moved up to the moderate group. The finance and support dimension fell from 73.9 to 39.2% because venture capital dropped from 150.6 to 10.7% of the average, and the innovators dimension fell from 79.1 to 48.1%. The EU average rose by 1.7 points.
What this means for businesses
- The scoreboard scores business R&D, product and process innovation, cooperation with institutions and patents, trademarks and designs. Funding calls look for the same things, so a project that improves these indicators usually scores better. Open calls and the basics of applying are covered in our guide EU grants for businesses in Croatia 2026, and wider support in business incentives in Croatia 2026.
- Cooperation is a Croatian strength, and the Integrator call finances consortia of at least three SMEs that become suppliers to a medium-sized or large integrator. Applications have been accepted since 5 May 2026.
- Croatia is at 87.1% of the EU average for SMEs with process innovations, so projects introducing new processes are also backed by the scoreboard indicators. We track open and upcoming calls in our guide EU grants for businesses in Croatia 2026.
- For R&D projects it is essential to set the starting and target technology readiness level (TRL) correctly, because eligibility and aid intensity depend on it.
- Knowledge-intensive services exports and technology-intensive goods are Croatia’s weakest indicators. Applicants with a realistic export plan have an advantage in calls that score growth in foreign sales.
- Government support of business R&D is Croatia’s weakest indicator, so for firms developing new products EU-funded calls and HAMAG-BICRO programmes are essential.
Methodology: values come from the profiles of Croatia and the other 26 member states in the European Innovation Scoreboard 2025 (European Commission, 15 July 2025) and are expressed as a percentage of the EU average in 2025 (EU = 100). Changes since 2018 are in points of the 2018 EU average, as published in the edition, and the 2018 value (61.2%) was calculated as the index minus the change. Indicator values are normalised scores relative to the EU average, not ratios of the underlying quantities. Group thresholds come from the methodology report. The split into indicators driven by firms and by the state is ours, not official. Business R&D data are from Eurostat (rd_e_gerdtot). Values from the 2026 edition appear only in the marked parts of the text. All ranks and differences were recalculated and checked.
Frequently asked questions
What is the European Innovation Scoreboard?
The European Innovation Scoreboard is an annual composite index by the European Commission that compares the innovation systems of EU member states, neighbouring countries and global competitors. The 2025 edition covers 32 indicators in 12 dimensions, from education and research to business investment, patents and exports.
What does it mean that Croatia is a moderate innovator?
That its summary index is between 70 and 100% of the EU average. In 2025 Croatia stood at 71.6%, last in the moderate group and 21st of 27 member states. Innovation leaders are above 125%, strong innovators between 100 and 125% and emerging innovators below 70%.
Where does Croatia lag most?
On government support of business R&D (7.9% of the EU average), knowledge-intensive services exports (12.7%), design applications (30.4%), labour productivity (31.0%) and the most cited publications (35.8%). Of the 12 dimensions only linkages is above the average.
Where is Croatia above the EU average?
On venture capital (150.6%), public-private co-publications (146.3%), innovation expenditure per person employed (107.4%), sales of innovations (102.1%) and job-to-job mobility (102.1%), while employed ICT specialists are at the average (100.0%). Venture capital is volatile and fell to 10.7% in the 2026 edition.
How much has Croatia’s index grown since 2018?
By 19.4 points, the second fastest growth in the EU after Estonia. In 2018 Croatia stood at 61.2% of the then EU average and in 2025 at 71.6%. The EU average rose by 12.6 points, so the gap narrowed from 38.8 to 32.0 points.
What changed in the 2026 edition?
The edition published on 9 July 2026 put Croatia at 69.2% of the EU average and moved it back to the emerging innovators, in 22nd place, mainly because of the fall in venture capital and in the share of innovative SMEs. Hungary moved up to the moderate group at the same time.

About the author
Davor Nikolić, MSc in Political Science
Co-founder and director of Omnia Solutions. He prepares and implements projects co-financed by EU and national funds, mainly in innovation, entrepreneurship and industry. From 2012 to 2014 he was an advisor in the Cabinet of the Minister of Entrepreneurship and Crafts, and from 2014 to 2018 a senior expert advisor for the implementation, evaluation and contracting of EU business projects at the Ministry of Economy, Entrepreneurship and Crafts. As a project manager, he has worked on the preparation and implementation of European and international projects with a total value of more than EUR 60 million. Since 2025 he has been an external member of the European Affairs Committee of the Croatian Parliament. He is a doctoral candidate in International Relations at the Faculty of Social Sciences, University of Ljubljana.
Sources
- European Commission, European Innovation Scoreboard 2025 (15 July 2025)
- European Commission, EIS 2025, Croatia country profile and profiles of the other member states (ec.europa.eu/assets/rtd/eis/2025/)
- European Commission, EIS 2025 methodology report
- European Commission, European Innovation Scoreboard overview page with the 2026 edition
- European Commission, EIS 2026, Croatia country profile (9 July 2026)
- European Commission, EIS 2024, Croatia country profile, EIS 2023 and EIS 2022
- European Commission, questions and answers on the European Innovation Scoreboard 2020 (23 June 2020)
- Eurostat, rd_e_gerdtot, R&D expenditure by sector of performance, % of GDP
- European Commission, ERA Country Report 2024 Croatia
Planning an R&D or innovation project?
Let us check which call fits your project and how to score well
We will review your project, open and upcoming calls from EU funds and national programmes and the evaluation criteria, and propose the best route to an application. The introductory call is free.