Updated on 29 October 2026 with the latest available data.
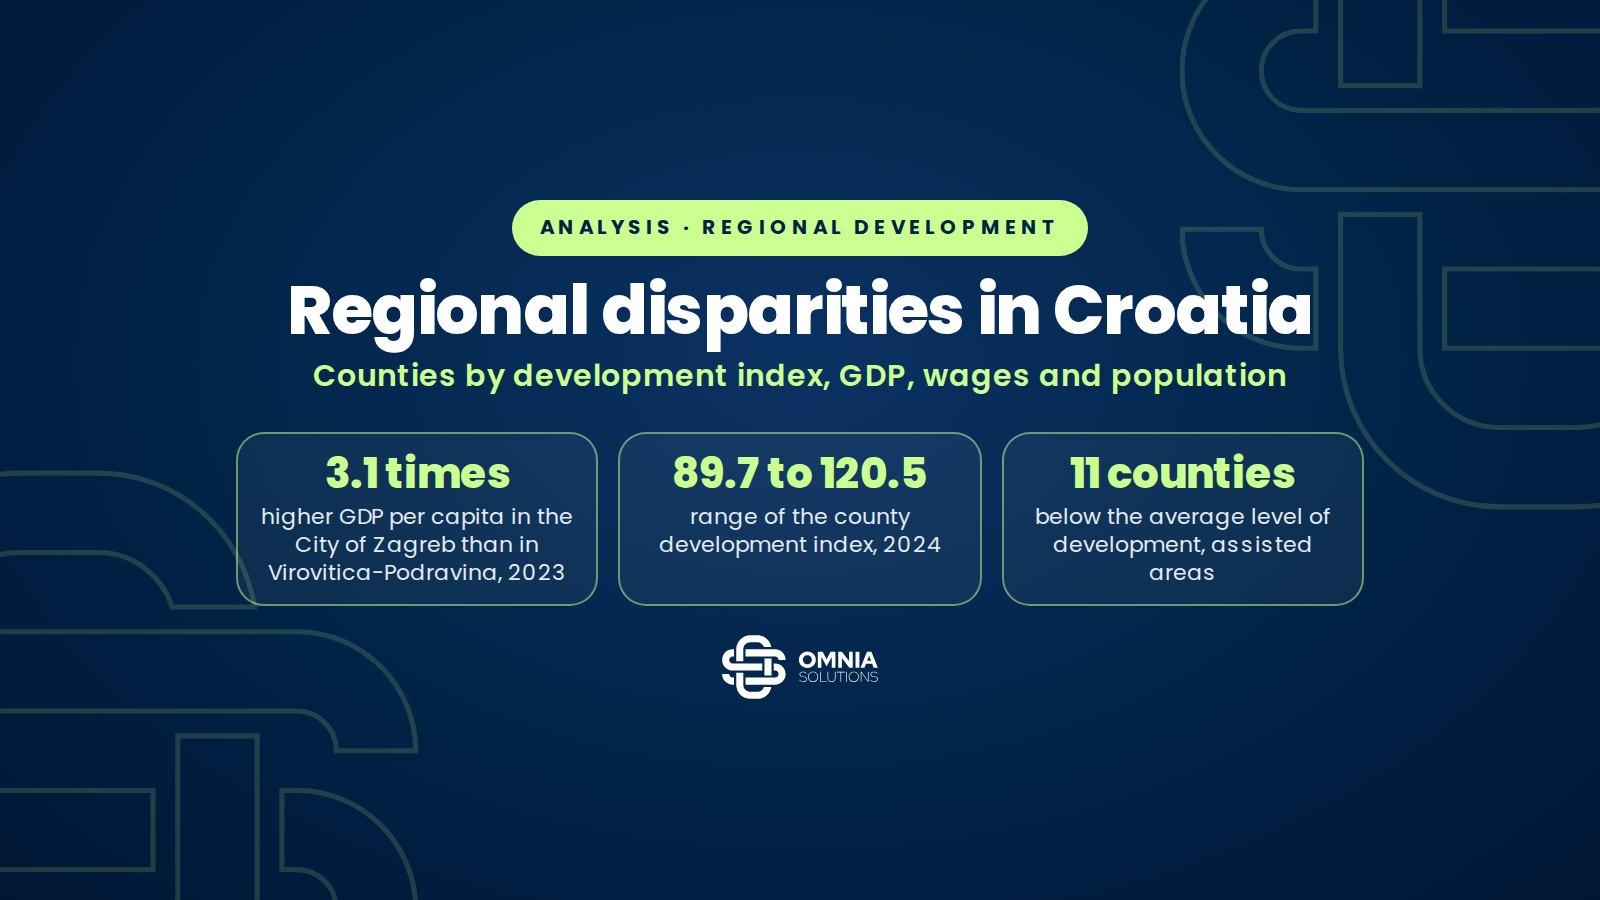
The differences between Croatian counties remain large. In 2023 the City of Zagreb had GDP per capita of EUR 34,518, while Virovitica-Podravina County had EUR 10,968, less than a third as much. The county development index ranges from 89.7 to 120.5, and 11 counties are below the average and have the status of assisted areas. In GDP per capita in purchasing power standards, the City of Zagreb stood at 131% of the EU average in 2024, and Pannonian Croatia at 53%. Every county lost population between the 2011 and 2021 censuses, and from 2024 to mid-2025 the population grew only in Zagreb, its surroundings and on the Adriatic coast. Under the new Regional Development Act, in force since 7 May 2026, development is assessed every five years.
In October 2026, alongside the 10th Days of Regional Development and EU Funds in Šibenik, the Ministry of Regional Development and EU Funds published “Regionalni razvoj u Hrvatskoj, 2026.” (Regional Development in Croatia 2026, in Croatian). This article summarises the key indicators of regional disparities, mainly from official sources, namely the development index, GDP per capita by county and region, wages and population. At the end we explain what regional disparities mean for state aid to businesses.
Summary
- The 2024 development index is highest in the City of Zagreb (120.5), Zagreb County (108.3) and Istria (107.3), and lowest in Virovitica-Podravina (89.7), Vukovar-Srijem (90.8) and Brod-Posavina (90.9).
- All eleven counties below the average have the status of assisted areas. The five least developed counties are all in Pannonian Croatia, four of them in Slavonia.
- Only the City of Zagreb, Primorje-Gorski Kotar and Istria have GDP per capita above the Croatian average.
- The average net wage in the second quarter of 2026 was EUR 1,553, and only the City of Zagreb, Zagreb County and Primorje-Gorski Kotar were above it.
- All regions have improved their position relative to the EU average since 2020, with Pannonian Croatia the slowest, rising from 46% to 53% in 2024.
- Regional disparities directly affect state aid. The maximum regional aid intensity for investment depends on the region and ranges from 35 to 75% of eligible costs.
Key figures
Regional disparities in Croatia
Sources: Croatian Bureau of Statistics (GDP 2023, population censuses); Ministry of Regional Development and EU Funds (development index 2024); Eurostat (2024, provisional); Official Gazette 45/2026.
The development index: how it is measured and where each county stands
The development index is a composite indicator the Croatian Government uses to classify counties, towns and municipalities. It is calculated from six indicators, namely the unemployment rate, income per capita, own-source budget revenue per capita, population change over ten years, the share of people aged 20 to 65 with higher education and the ageing index. The indicators have no predefined weights. They are standardised and combined into an “adjusted average”. A value of 100 is the Croatian average.
According to the classification decision of January 2024, based on data for 2020–2022, the City of Zagreb has an index of 120.517, followed by Zagreb County (108.271), Istria (107.250), Dubrovnik-Neretva (105.303) and Zadar County (104.439). These counties are in group IV. At the bottom are Virovitica-Podravina (89.745), Vukovar-Srijem (90.843), Brod-Posavina (90.913), Sisak-Moslavina (91.591) and Požega-Slavonia County (92.990), all in group I.
The 11 counties in groups I and II have the status of assisted areas. Among towns and municipalities, 287 are below the average, 17 fewer than in the 2018 assessment. The gap in the index between the most and the least developed town or municipality narrowed from 80.07 to 52.09 points. According to an analysis by the Institute of Economics, Zagreb (EIZ), Zadar County moved up to group IV compared with the 2018 assessment, Primorje-Gorski Kotar dropped to group III, and Požega-Slavonia dropped from group II to group I.
Interactive chart
Counties: development index, GDP per capita and wages
City of Zagreb
Zagreb County
Istria
Dubrovnik-Neretva
Zadar
Primorje-Gorski Kotar
Varaždin
Split-Dalmatia
Međimurje
Krapina-Zagorje
Koprivnica-Križevci
Karlovac
Lika-Senj
Šibenik-Knin
Osijek-Baranja
Bjelovar-Bilogora
Požega-Slavonia
Sisak-Moslavina
Brod-Posavina
Vukovar-Srijem
Virovitica-Podravina
An index of 100 is the Croatian average. The five least developed counties are all in Pannonian Croatia, four of them in Slavonia. The most developed are the City of Zagreb, Zagreb County and Istria.
Show the data in a table
| County | Development index 2024 | GDP per capita 2023 | Net wage, Q2 2026 |
|---|---|---|---|
| City of Zagreb | 120.517 | EUR 34,500 | EUR 1,784 |
| Zagreb County | 108.271 | EUR 18,500 | EUR 1,583 |
| Istria | 107.250 | EUR 22,900 | EUR 1,455 |
| Dubrovnik-Neretva | 105.303 | EUR 19,900 | EUR 1,446 |
| Zadar | 104.439 | EUR 16,600 | EUR 1,462 |
| Primorje-Gorski Kotar | 103.860 | EUR 23,500 | EUR 1,564 |
| Varaždin | 103.030 | EUR 18,100 | EUR 1,448 |
| Split-Dalmatia | 102.102 | EUR 16,600 | EUR 1,494 |
| Međimurje | 101.841 | EUR 17,300 | EUR 1,436 |
| Krapina-Zagorje | 101.297 | EUR 13,600 | EUR 1,525 |
| Koprivnica-Križevci | 99.622 | EUR 16,900 | EUR 1,437 |
| Karlovac | 97.951 | EUR 15,100 | EUR 1,535 |
| Lika-Senj | 95.575 | EUR 17,200 | EUR 1,410 |
| Šibenik-Knin | 95.396 | EUR 15,700 | EUR 1,460 |
| Osijek-Baranja | 94.440 | EUR 15,200 | EUR 1,478 |
| Bjelovar-Bilogora | 93.681 | EUR 13,700 | EUR 1,404 |
| Požega-Slavonia | 92.990 | EUR 11,100 | EUR 1,423 |
| Sisak-Moslavina | 91.591 | EUR 15,300 | EUR 1,448 |
| Brod-Posavina | 90.913 | EUR 13,200 | EUR 1,388 |
| Vukovar-Srijem | 90.843 | EUR 12,400 | EUR 1,409 |
| Virovitica-Podravina | 89.745 | EUR 11,000 | EUR 1,373 |
Sources: Ministry of Regional Development and EU Funds, development index values 2024 (data for 2020–2022); Eurostat, GDP per capita by county (nama_10r_3gdp, rounded to EUR 100); Croatian Bureau of Statistics, average wages by county in the second quarter of 2026.
GDP per capita: Zagreb and the rest of the country
According to final data from the Croatian Bureau of Statistics for 2023, Croatia’s GDP per capita was EUR 20,526. The City of Zagreb had EUR 34,518, 68.2% above the average, and Primorje-Gorski Kotar (EUR 23,499) and Istria (EUR 22,910) were also above the average. All the other 18 counties were below it. Virovitica-Podravina (EUR 10,968) and Požega-Slavonia (EUR 11,063) counties had the lowest GDP per capita, 53 to 54% of the average.
The ratio between the City of Zagreb and Virovitica-Podravina County is 3.1. According to the Institute of Economics, Zagreb, the ratio was 2.9 in 2000 and 3.3 in 2015, so the gap has narrowed slightly in recent years. The City of Zagreb generates a third of Croatia’s GDP, and together with Adriatic Croatia almost two thirds.
Four regions compared with the EU average
For EU cohesion policy, Croatia is divided into four NUTS 2 statistical regions, Pannonian Croatia (eight counties), Adriatic Croatia (seven counties), Northern Croatia (five counties) and the City of Zagreb. According to Eurostat, GDP per capita in purchasing power standards in 2024 was 131% of the EU average in the City of Zagreb, 73% in Adriatic Croatia, 64% in Northern Croatia and 53% in Pannonian Croatia. Croatia as a whole stands at 78% of the EU average. Data for 2024 are provisional.
Interactive chart
Four regions compared with the EU average: GDP per capita in purchasing power standards
Show the data in a table
| Year | City of Zagreb | Croatia | Adriatic Croatia | Northern Croatia | Pannonian Croatia |
|---|---|---|---|---|---|
| 2020 | 116 | 66 | 59 | 54 | 46 |
| 2021 | 121 | 71 | 66 | 57 | 50 |
| 2022 | 119 | 72 | 69 | 59 | 50 |
| 2023 | 131 | 78 | 73 | 66 | 53 |
| 2024 | 131 | 78 | 73 | 64 | 53 |
A value of 100 is the EU-27 average. Data for 2024 are provisional. All regions are growing, but the gap between the City of Zagreb and Pannonian Croatia remains wide.
Source: Eurostat, GDP per capita in purchasing power standards, NUTS 2 regions (nama_10r_2gdp, published on 10 February 2026).
All regions have improved their position since 2020, but at different speeds. Pannonian Croatia rose from 46 to 53% of the EU average, and Adriatic Croatia from 59 to 73%. The Institute of Economics, Zagreb, reports that from 2000 to 2023 Northern Croatia converged towards the EU average the fastest and Pannonian Croatia the slowest. Under cohesion policy rules, regions below 75% of the EU average are considered less developed and have the highest co-financing rates. The current classification of regions is based on older data, but even on 2024 data three Croatian regions are below that threshold.
Wages and unemployment
The average net wage in Croatia in the second quarter of 2026 was EUR 1,553. Only three counties were above the average, the City of Zagreb (EUR 1,784), Zagreb County (EUR 1,583) and Primorje-Gorski Kotar (EUR 1,564). Wages are lowest in Virovitica-Podravina (EUR 1,373), Brod-Posavina (EUR 1,388) and Bjelovar-Bilogora County (EUR 1,404). The gap between the highest and lowest average county wage, about 30%, is much smaller than the gap in GDP per capita.
According to Croatian Employment Service data reported by the Hina news agency, registered unemployment at the end of June 2026 was the lowest on record (59,423 people). For a comparison between counties, in the development index calculation the average unemployment rate for 2020–2022 ranged from 3.21% in Varaždin County to 13.25% in Virovitica-Podravina County.
Population: decline everywhere, growth only in Zagreb and on the Adriatic
Between the 2011 and 2021 censuses Croatia lost 413,056 inhabitants, or 9.64%. Every county had fewer inhabitants. The largest declines were in Vukovar-Srijem (−20.28%), Sisak-Moslavina (−19.04%), Požega-Slavonia (−17.88%) and Brod-Posavina County (−17.85%), and the smallest in the City of Zagreb (−2.90%), Zagreb County (−5.55%) and Dubrovnik-Neretva (−5.71%).
More recent estimates show a reversal in part of the country. According to the Croatian Bureau of Statistics, Croatia had 3,874,993 inhabitants in mid-2025, 8,760 more than a year earlier. The population grew in Zagreb County, the City of Zagreb and all seven Adriatic counties, and fell the most in Osijek-Baranja (−1,920) and Sisak-Moslavina County (−1,531).
Interactive chart
Population by county
City of Zagreb
Zagreb County
Dubrovnik-Neretva
Zadar
Istria
Split-Dalmatia
Međimurje
Krapina-Zagorje
Varaždin
Primorje-Gorski Kotar
Šibenik-Knin
Koprivnica-Križevci
Karlovac
Bjelovar-Bilogora
Osijek-Baranja
Lika-Senj
Virovitica-Podravina
Brod-Posavina
Požega-Slavonia
Sisak-Moslavina
Vukovar-Srijem
Istria
Zadar
Zagreb County
Dubrovnik-Neretva
Lika-Senj
Split-Dalmatia
Šibenik-Knin
Primorje-Gorski Kotar
City of Zagreb
Međimurje
Krapina-Zagorje
Varaždin
Koprivnica-Križevci
Karlovac
Osijek-Baranja
Bjelovar-Bilogora
Brod-Posavina
Virovitica-Podravina
Vukovar-Srijem
Požega-Slavonia
Sisak-Moslavina
Every county had fewer inhabitants at the second census. The decline was largest in Vukovar-Srijem (−20.28%) and smallest in the City of Zagreb (−2.90%).
Sources: Croatian Bureau of Statistics, 2011 and 2021 censuses and population estimate for 2025 (September 2026). Percentages calculated by Omnia Solutions.
The new Regional Development Act
On 21 April 2026 the Croatian Parliament adopted a new Regional Development Act of the Republic of Croatia (Official Gazette 45/2026), which has been in force since 7 May 2026. The main provisions are listed below.
- Development is assessed every five years instead of every three, with monitoring between assessments.
- By 7 May 2027 the Government will adopt a new regulation setting out the indicators and the method for calculating the development index. Until then the existing regulation applies, and the January 2024 classification remains in force until a new classification decision.
- Counties are still classified into four groups, and towns and municipalities into eight. Assisted areas are counties in groups I and II and towns and municipalities in groups I to IV.
- A Regional Development Council chaired by the Prime Minister is established, together with councils for Slavonia, Baranja and Srijem, for the North, for Central Croatia and for Adriatic Croatia.
- The Act classifies urban areas into categories and regulates the accreditation of regional coordinators, which are the county development agencies.
- In their development plans, counties, towns and municipalities plan demographic, social, economic and spatial-environmental measures.
What regional disparities mean for state aid to businesses
The location of an investment sets the maximum permitted regional aid intensity. Under the regional aid map for 2022–2027, large enterprises can receive up to 50% of eligible costs in Pannonian and Northern Croatia, 40% in Adriatic Croatia and 35% in the City of Zagreb. Medium-sized enterprises receive 10 percentage points more and small enterprises 20 points more. For Sisak-Moslavina County, as a Just Transition Fund area, the European Commission approved higher intensities in March 2023, namely 60% for large, 70% for medium-sized and 75% for small enterprises.
Interactive chart
Maximum regional aid intensity for investment, 2022–2027
Pannonian Croatia
Northern Croatia
Adriatic Croatia
City of Zagreb
Sisak-Moslavina County
Pannonian Croatia
Northern Croatia
Adriatic Croatia
City of Zagreb
Sisak-Moslavina County
Pannonian Croatia
Northern Croatia
Adriatic Croatia
City of Zagreb
Sisak-Moslavina County
In the City of Zagreb, large enterprises can receive aid only for initial investment in a new economic activity.
Sources: European Commission, decision SA.64581 on the regional aid map for Croatia 2022–2027 and the amendment for Sisak-Moslavina County of 15 March 2023.
Under the Investment Promotion Act, aid for creating new jobs also depends on the registered unemployment rate in the county where the investment is made, so the higher the unemployment, the higher the aid per job. We explain how tax incentives and aid are calculated in our article on investment tax incentives, and give a broader overview of state aid rules in our article on state aid in Croatia and the EU.
Assisted area status is sometimes also an eligibility condition or a selection criterion in calls for municipalities, towns and public infrastructure, for example in programmes of the Ministry of Regional Development and EU Funds. Calls for businesses should always be checked one by one, because the criteria differ from call to call.
Methodology: development index values are taken from the table published by the Ministry of Regional Development and EU Funds with the classification decision of January 2024 (Official Gazette 3/2024). GDP per capita for 2023 is given in the text according to final data from the Croatian Bureau of Statistics and in the chart according to Eurostat, rounded to EUR 100, so that all counties are shown from the same source. Regional data in purchasing power standards are from Eurostat and provisional for 2024. We calculated population changes from Croatian Bureau of Statistics data. Data on changes in groups since 2018 and on the GDP per capita ratio over time are taken from Regio-novosti No. 23 and No. 27, published by the Institute of Economics, Zagreb.
This is the fifth of five articles on Croatia and EU money. The others cover absorption of 2021–2027 EU funds, participation in Horizon Europe, state aid and net balances in the EU budget.
Frequently asked questions
Which is the most developed and which the least developed county in Croatia?
According to the 2024 development index, the City of Zagreb is the most developed (120.517), followed by Zagreb County and Istria. Virovitica-Podravina is the least developed (89.745), followed by Vukovar-Srijem and Brod-Posavina.
How many counties are assisted areas?
The eleven counties in development groups I and II have the status of assisted areas. Among towns and municipalities, 287 are assisted areas.
How large is the gap in GDP per capita between counties?
In 2023 the City of Zagreb had GDP per capita of EUR 34,518, and Virovitica-Podravina County EUR 10,968, less than a third as much. Only three counties are above the Croatian average of EUR 20,526.
Which regions in Croatia are below 75% of the EU average?
According to Eurostat data for 2024, Pannonian Croatia (53%), Northern Croatia (64%) and Adriatic Croatia (73%) are below 75% of the EU average in purchasing power standards, while the City of Zagreb is at 131%.
What does the new Regional Development Act change?
The Act has been in force since 7 May 2026. Development is assessed every five years instead of three, a new regulation on the development index is due by May 2027, and a Regional Development Council and four regional councils are established.
How does the location of an investment affect the amount of aid?
The maximum regional aid intensity depends on the region. For large enterprises it is 50% in Pannonian and Northern Croatia, 40% in Adriatic Croatia, 35% in the City of Zagreb and 60% in Sisak-Moslavina County. Small and medium-sized enterprises are eligible for higher intensities.
Sources
- Ministry of Regional Development and EU Funds, 10th Days of Regional Development and EU Funds and the publication Regionalni razvoj u Hrvatskoj, 2026. (October 2026, in Croatian)
- Ministry of Regional Development and EU Funds, development index values 2024 (in Croatian)
- Decision on the classification of local and regional self-government units by level of development, Official Gazette 3/2024 (in Croatian)
- Croatian Bureau of Statistics, GDP for Croatia, its regions and counties in 2023 (in Croatian)
- Eurostat, regional GDP in 2024 (10 February 2026)
- Croatian Bureau of Statistics, population estimate for 2025 (in Croatian)
- Croatian Bureau of Statistics, final results of the 2021 census (in Croatian)
- Croatian Bureau of Statistics, wages by county in the second quarter of 2026 (in Croatian)
- Informator (Hina), registered unemployment at the end of June 2026 (in Croatian)
- Regional Development Act of the Republic of Croatia, Official Gazette 45/2026 (in Croatian)
- European Commission, regional aid map for Croatia 2022–2027
- Invest in Croatia, amendment to the regional aid map for Sisak-Moslavina County (15 March 2023)
- Act amending the Investment Promotion Act, Official Gazette 136/2024 (in Croatian)
- Institute of Economics, Zagreb, Regio-novosti No. 23 (March 2024, in Croatian)
- Institute of Economics, Zagreb, Regio-novosti No. 27 (March 2026, in Croatian)
Planning an investment outside Zagreb?
Let us check how much aid you can receive at your location
We will calculate the maximum aid intensity and tax incentives and check open calls for your county and type of investment. The introductory call is free.