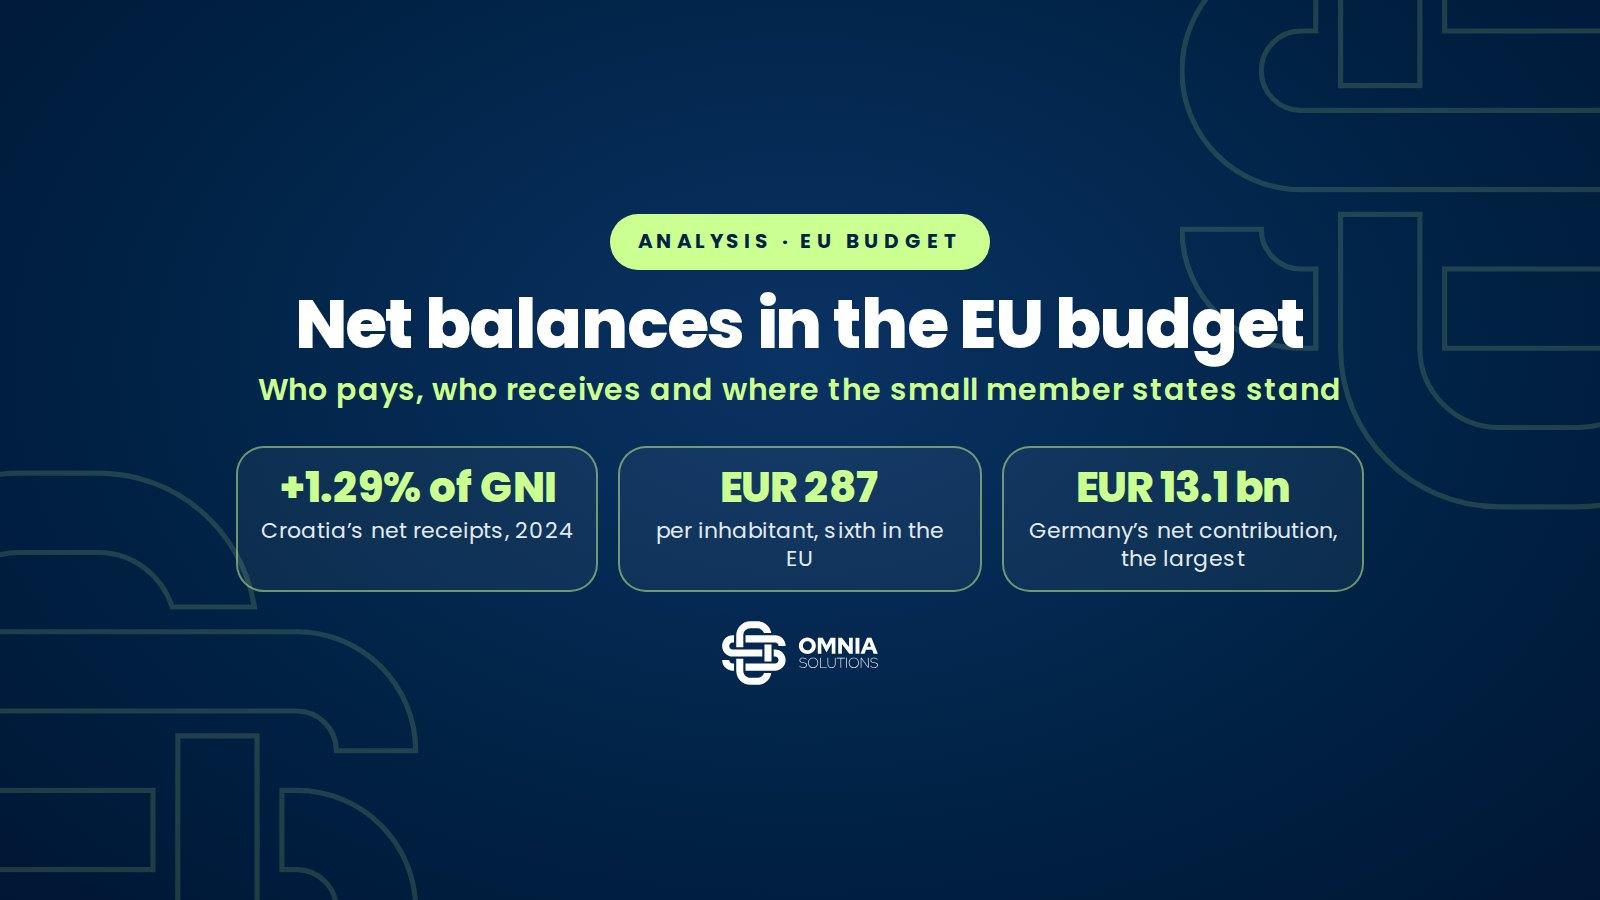
On the operating budgetary balance, Croatia received a net EUR 1,107 million from the EU budget in 2024. That is 1.29% of gross national income (GNI), sixth among the 27 member states, or EUR 287 per inhabitant. In 2023 Croatia ranked first in the EU with 3.07% of GNI. Relative to the size of their economies Latvia (2.60% of GNI), Lithuania and Estonia receive the most, while the largest net contributor is Germany (EUR 13.1 billion). The European Commission has not published official net balances since the 2020 data, so these figures are a calculation by the German institute IW Köln using the Commission’s former methodology. According to the Croatian Government, from accession to mid-2025 Croatia paid EUR 6.51 billion into the EU budget and received EUR 23.26 billion into its state budget, including the National Recovery and Resilience Plan.
A net balance shows the difference between what a country receives from the EU budget and what it pays in. It is popular in political debate, especially ahead of negotiations on a new multiannual budget, but it is easy to misread. This analysis shows the net balances of all 27 member states for 2024, the latest year with data, looks closely at the small member states, explains how the net balance is calculated and what it does not show, and summarises the proposal for the 2028–2034 budget.
In brief
- In 2024 Croatia received a net EUR 1,107 million, 1.29% of GNI and EUR 287 per inhabitant. It ranks sixth in the EU on both measures.
- Including NextGenerationEU grants, net receipts rise to 1.73% of GNI, third in the EU.
- The fall from 2023, when Croatia ranked first with 3.07% of GNI, is mainly due to lower cohesion policy payments to Croatia (from 2.45% to 0.88% of GNI), part of an EU-wide fall in 2024.
- In 2024 there were nine net contributors and 18 net recipients. In euros, Germany, France and Italy paid the most, while Greece, Poland and Romania received the most.
- The Baltic states and Luxembourg receive the most in relative terms. Latvia, Lithuania and Estonia lead by share of GNI, Luxembourg per inhabitant.
- A net balance does not measure the benefits of membership, because it leaves out the single market, spillover effects and political stability, and a single year says little given the payment cycle.
Key figures
Croatia in the EU budget, 2024
Sources: IW Köln, IW-Report 62/2025 and bpb (October 2025), calculated with the European Commission’s former methodology from Commission data; Croatian Government, report on the use of EU funds for the first half of 2025.
What a net balance is and how it is calculated
Up to and including the 2019 data, the European Commission calculated an operating budgetary balance for each member state. Administrative spending, mostly in Belgium and Luxembourg, is deducted from EU spending in the country, and traditional own resources, meaning customs duties that countries collect on the EU’s behalf, are deducted from its payments. National contributions (based on GNI, VAT and non-recycled plastic packaging waste) are then scaled so that all balances add up to zero. Spending is attributed to the country where the main recipient is based.
The Commission stopped publishing net balances from the 2020 data onwards. In 2021 Germany and seven other member states, including Denmark, Austria, Finland and the Netherlands, asked it to continue, but the Commission refused, considering them an imprecise measure. It still publishes raw data on spending and revenue by country, and independent institutes use them to calculate net balances with the former methodology. This article uses the calculation by the German Economic Institute (IW Köln) for 2024, whose euro amounts match those of the German Federal Agency for Civic Education (bpb).
Spending under NextGenerationEU, which finances the Recovery and Resilience Facility, is shown separately because it is financed by common EU borrowing, not regular contributions. It is excluded from the basic calculation, and IW Köln also publishes a variant including grants from that instrument.
Who pays and who receives: 27 member states in 2024
In 2024 there were nine net contributors and 18 net recipients. The largest net contributors in euros are Germany (EUR 13,110 million), France (EUR 4,771 million), Italy (EUR 1,612 million), the Netherlands (EUR 1,486 million) and Sweden (EUR 1,004 million). Relative to their economies Germany (0.29% of GNI), Austria (0.18%), Ireland and Sweden (0.17% each) pay the most.
The largest net recipients in euros are Greece (EUR 3,464 million), Poland (EUR 2,894 million), Romania (EUR 2,694 million), Spain (EUR 2,216 million) and Hungary (EUR 1,958 million). Relative to GNI, Latvia (2.60%), Lithuania (1.65%), Estonia (1.59%), Greece (1.50%) and Bulgaria (1.38%) lead, followed by Croatia with 1.29%.
Interactive chart
Net balances of EU member states in 2024
Latvia
Lithuania
Estonia
Greece
Bulgaria
Croatia
Slovakia
Hungary
Romania
Slovenia
Luxembourg
Malta
Portugal
Cyprus
Czechia
Poland
Belgium
Spain
Italy
Finland
Denmark
Netherlands
France
Ireland
Sweden
Austria
Germany
Luxembourg
Latvia
Estonia
Lithuania
Greece
Croatia
Slovakia
Slovenia
Bulgaria
Hungary
Malta
Romania
Cyprus
Portugal
Czechia
Belgium
Poland
Spain
Italy
Finland
France
Denmark
Netherlands
Austria
Sweden
Ireland
Germany
Greece
Poland
Romania
Spain
Hungary
Bulgaria
Slovakia
Lithuania
Portugal
Czechia
Croatia
Latvia
Belgium
Estonia
Slovenia
Luxembourg
Cyprus
Malta
Finland
Denmark
Ireland
Austria
Sweden
Netherlands
Italy
France
Germany
Relative to gross national income, Latvia, Lithuania and Estonia receive the most, while Germany, Austria, Ireland and Sweden pay the most. Croatia is sixth.
Show the data in a table
| Country | % of GNI | EUR per inhabitant | EUR million |
|---|---|---|---|
| Latvia | +2.60% | +EUR 544.3 | +EUR 1,019 m |
| Lithuania | +1.65% | +EUR 435.3 | +EUR 1,256 m |
| Estonia | +1.59% | +EUR 443.7 | +EUR 610 m |
| Greece | +1.50% | +EUR 333.0 | +EUR 3,464 m |
| Bulgaria | +1.38% | +EUR 211.5 | +EUR 1,363 m |
| Croatia | +1.29% | +EUR 286.7 | +EUR 1,107 m |
| Slovakia | +1.06% | +EUR 250.4 | +EUR 1,358 m |
| Hungary | +0.97% | +EUR 204.2 | +EUR 1,958 m |
| Romania | +0.78% | +EUR 141.3 | +EUR 2,694 m |
| Slovenia | +0.78% | +EUR 242.5 | +EUR 515 m |
| Luxembourg | +0.62% | +EUR 565.2 | +EUR 380 m |
| Malta | +0.56% | +EUR 192.8 | +EUR 109 m |
| Portugal | +0.43% | +EUR 112.1 | +EUR 1,193 m |
| Cyprus | +0.38% | +EUR 118.7 | +EUR 115 m |
| Czechia | +0.37% | +EUR 102.9 | +EUR 1,122 m |
| Poland | +0.36% | +EUR 79.0 | +EUR 2,894 m |
| Belgium | +0.15% | +EUR 80.8 | +EUR 955 m |
| Spain | +0.14% | +EUR 45.6 | +EUR 2,216 m |
| Italy | −0.07% | −EUR 27.3 | −EUR 1,612 m |
| Finland | −0.11% | −EUR 55.1 | −EUR 309 m |
| Denmark | −0.12% | −EUR 80.6 | −EUR 481 m |
| Netherlands | −0.13% | −EUR 82.8 | −EUR 1,486 m |
| France | −0.16% | −EUR 69.7 | −EUR 4,771 m |
| Ireland | −0.17% | −EUR 131.1 | −EUR 701 m |
| Sweden | −0.17% | −EUR 95.2 | −EUR 1,004 m |
| Austria | −0.18% | −EUR 93.2 | −EUR 854 m |
| Germany | −0.29% | −EUR 157.1 | −EUR 13,110 m |
Source: IW Köln, IW-Report 62/2025 and bpb (October 2025), calculated with the European Commission’s former methodology from Commission data. A positive value means a net recipient. Amounts exclude NextGenerationEU.
Total EU budget spending in 2024 was about EUR 146 billion, EUR 19 billion less than a year earlier, mainly because countries claimed less cohesion funding. The 2021–2027 period was only getting under way, while 2014–2020 expenditure could only be incurred until the end of 2023. According to the Bundesbank, countries also gave priority to the Recovery and Resilience Facility. More on this in our article on the absorption of 2021–2027 EU funds.
Small member states: the most per inhabitant
Small member states receive the most from the EU budget in relative terms. In 2024 Latvia received a net EUR 544 per inhabitant, Estonia EUR 444 and Lithuania EUR 435. Slovenia received EUR 243 per inhabitant (0.78% of GNI), Slovakia EUR 250 (1.06%), Malta EUR 193 (0.56%) and Cyprus EUR 119 (0.38%). Croatia, with EUR 287 per inhabitant, ranks sixth.
Luxembourg is a special case. With EUR 565 per inhabitant it ranked first on this measure in 2024, although it was a net contributor in 2023. The reason is large payments under the EU space programme and the European Defence Fund to recipients based in Luxembourg. This shows a limit of the method, because spending is attributed to the country where the recipient is based, not where the money is spent.
Ireland, Denmark and Finland, the other richer small member states, were net contributors in 2024. Ireland paid EUR 131 per inhabitant (0.17% of GNI), Denmark EUR 81 (0.12%) and Finland EUR 55 (0.11%). For 2021–2027 Denmark also receives a lump-sum reduction of its contribution, as do Germany, the Netherlands, Sweden and Austria.
Chart
Small member states: 2014–2018 average and 2024, % of GNI
Latvia
Lithuania
Estonia
Croatia
Slovakia
Slovenia
Luxembourg
Malta
Cyprus
Finland
Denmark
Ireland
Croatia, Cyprus and Luxembourg are the only small member states whose net receipts in 2024 were higher than their 2014–2018 average. Lithuania, Slovakia and Malta receive about half as much as before relative to GNI.
Sources: European Commission, technical briefing of 5 November 2019; IW Köln, IW-Report 62/2025 and bpb (October 2025), calculated with the European Commission’s former methodology from Commission data.
Croatia from accession to today
According to the Commission’s last official overview, Croatia received on average a net EUR 0.38 billion a year in 2014–2018, or 0.79% of GNI. According to IW Köln, net receipts were 3.08% of GNI in 2021, 2.17% in 2022, 3.07% in 2023 and 1.29% in 2024. In 2021 and 2023 Croatia ranked first in the EU on this measure. Including NextGenerationEU grants, net receipts exceeded 4% of GNI in 2022 and 2023.
Chart
Croatia: net balance in the EU budget, % of GNI
2014–2018 average
2021
2022
2023
2024
Figures for 2019 and 2020 are not available on a comparable basis. The rise from the 2014–2018 average and the drop in 2024 follow the cohesion policy payment cycle.
Sources: European Commission, technical briefing of 5 November 2019 (2014–2018 average); IW Köln, reports for 2021–2024.
In its reports on the use of EU funds the Croatian Government also tracks cash flows through the state budget. From accession on 1 July 2013 to 30 June 2025 Croatia paid EUR 6.51 billion into the EU budget and received EUR 23.26 billion into the state budget, including the National Recovery and Resilience Plan. The difference in Croatia’s favour is EUR 16.75 billion, or EUR 12.26 billion without recovery funds. These figures are not comparable with the net balance, because they cover only flows through the state budget and therefore exclude, for example, Horizon Europe funding paid directly to companies and research institutions.
What a net balance does not show
- The benefits of the single market. Tariff-free exports, free movement and the common currency do not appear in budget flows, and the Commission itself warns that these benefits are ignored.
- Spillover effects. Part of the money received by less developed member states flows back to richer ones through orders for equipment and services.
- The multiannual cycle. Cohesion payments rise towards the end of each period, so a single year can give a distorted picture, as for Croatia between 2023 and 2024.
- Where money is actually spent. Spending is attributed to the country where the main recipient is based, as in the case of Luxembourg.
- The zero sum. One country’s surplus is by definition another’s deficit, so net balances say nothing about how much the EU budget brings to the economy as a whole.
The 2028–2034 budget: what is proposed
In July 2025 the European Commission proposed a multiannual financial framework for 2028–2034 worth almost EUR 2 trillion, on average 1.26% of EU GNI. In addition to existing sources it proposes five new own resources, from electronic waste and tobacco to the emissions trading system, which would raise about EUR 44 billion a year. Cohesion and agricultural policy would be merged into national and regional partnership plans, with a mandatory minimum for less developed regions. The proposal has not yet been adopted.
Two figures for Croatia have been reported publicly. According to the Croatian news agency Hina, the Commission proposed EUR 16.8 billion, while the Prime Minister spoke in December 2025 of about EUR 19 billion based on current projections. We could not verify the official allocation by country, so both figures should be treated with caution. More on the changes for innovation funding in our article on EU innovation funding in the 2028–2034 MFF.
What this means for businesses
A net balance is a macroeconomic figure and does not in itself tell a business how much money it can obtain. It does show two things. Croatia is still among the member states that receive the most from the EU budget in relative terms, so sources such as cohesion funds, research and innovation programmes and financial instruments will remain important in the next period. As Croatia becomes more developed, it can expect lower net receipts over time, so the quality of projects will matter more and more.
Methodology: net balances for 2021–2024 were calculated by the German Economic Institute (IW Köln) from European Commission data on spending and revenue by country, using the operating budgetary balance method the Commission applied up to the 2019 data. The 2024 amounts in EUR million match the calculation of the German Federal Agency for Civic Education (bpb), and the balances of all 27 member states add up to zero. Per-inhabitant figures are from bpb (Eurostat population on 1 January 2024) and shares of GNI from IW Köln. The 2014–2018 average is the Commission’s last official overview, in 2018 prices. Independent calculations can differ. For the Netherlands, for example, the Netherlands Court of Audit (Algemene Rekenkamer) reports EUR −1,837.8 million and IW Köln EUR −1,485.7 million.
This is the fourth of five articles on Croatia and EU money. The others cover absorption of 2021–2027 EU funds, participation in Horizon Europe, state aid and regional disparities by county.
Frequently asked questions
Is Croatia a net recipient from the EU budget?
Yes. In 2024 Croatia received EUR 1,107 million more from the EU budget than it paid in, or 1.29% of GNI and EUR 287 per inhabitant. It ranks sixth in the EU on both measures.
Which countries pay the most into the EU budget?
In euros the largest net contributor is Germany (EUR 13.1 billion in 2024), followed by France, Italy, the Netherlands and Sweden. Relative to GNI, Germany, Austria, Ireland and Sweden pay the most.
Why does the European Commission no longer publish net balances?
The Commission considers net balances an imprecise measure that ignores the benefits of the single market and spillover effects. From the 2020 data it publishes only raw spending and revenue data, and independent institutes calculate the net balances.
How much has Croatia paid into the EU budget since accession?
According to the Croatian Government, from 1 July 2013 to 30 June 2025 Croatia paid EUR 6.51 billion and received EUR 23.26 billion into its state budget, including the National Recovery and Resilience Plan.
Why were Croatia’s net receipts lower in 2024 than in 2023?
Because of the cohesion payment cycle. Expenditure from 2014–2020 could only be incurred until the end of 2023, and the 2021–2027 period was only getting under way, so payments across the EU were lower.
How much could Croatia receive from the 2028–2034 budget?
We could not verify the official allocation by country. According to Hina, the Commission proposed EUR 16.8 billion, while the Prime Minister spoke of about EUR 19 billion based on current projections.
Sources
- IW Köln, IW-Report 62/2025: Wer ist Nettozahler, wer Nettoempfänger (November 2025)
- bpb, Nettozahler und Nettoempfänger in der EU (October 2025)
- European Commission, EU spending and revenue by country
- European Commission, technical briefing on the EU’s long-term budget (5 November 2019)
- European Parliament, The net operating balances: variants, emerging numbers and history (2020)
- Deutsche Bundesbank, Monthly Report on the 2024 EU budget (October 2025)
- Croatian Government, report on the use of EU funds, 1 January to 30 June 2025 (in Croatian)
- IW Köln, IW-Report 55/2022 (2021 data)
- IW Köln, IW-Report 48/2023 (2022 data)
- IW Köln, IW-Report 2024 (2023 data)
- German Bundestag, Drucksache 20/9582 (November 2023)
- Netherlands Court of Audit, the Netherlands’ net position 2020–2024 (December 2025)
- Croatia Week (Hina), Commission proposal for Croatia (18 July 2025)
- Croatian Government, funds for Croatia in the new EU budget (4 December 2025, in Croatian)
- European Commission, the 2028–2034 EU budget (proposal)
Planning an EU-funded project?
Let us prepare your project for this and the next funding period
We will review your project, open and upcoming calls and the opportunities in 2028–2034. The introductory call is free.