Updated on 30 October 2026. On 15 September 2026 Eurostat published data for the second quarter of 2026, when Croatia had 1.3% and the EU 2.0%. Croatia’s rate for the first quarter of 2026 was revised from 1.4% to 1.5%. The Ministry of the Interior reported 106,395 residence and work permits for the first seven months of 2026, against 115,023 in the same period of 2025. The Integrator call reopens on 17 November 2026. Data from Eurostat databases were downloaded on 30 October 2026.
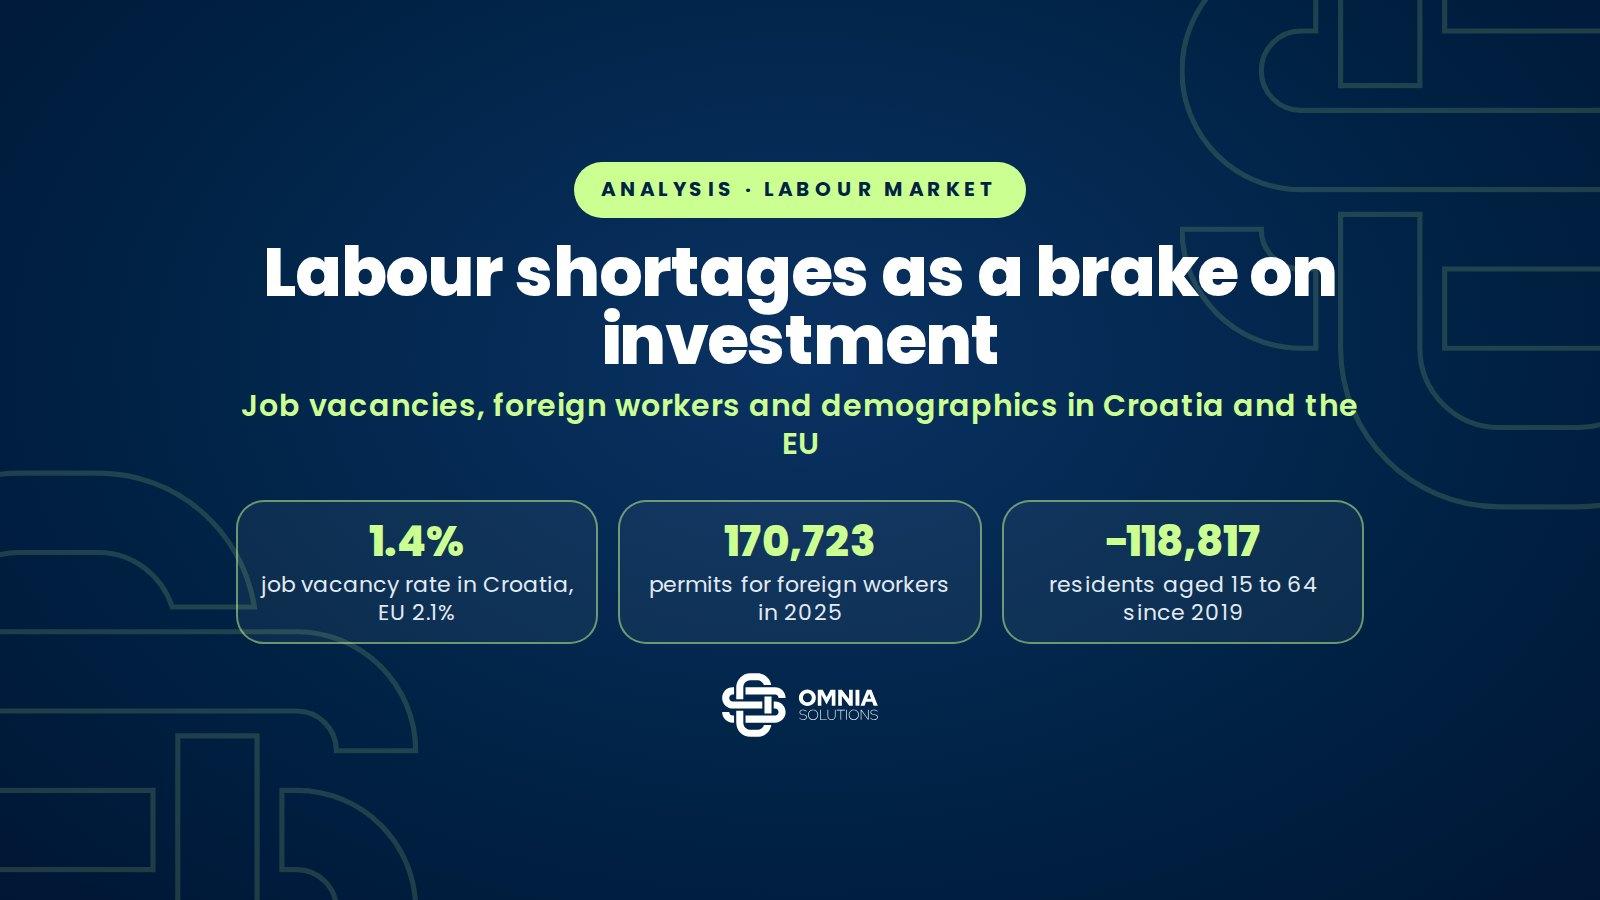
In the first quarter of 2026 Croatia had a job vacancy rate of 1.4%, against 2.1% in the EU, and was among the eight member states with the lowest rate. At the same time 170,723 residence and work permits were issued to foreigners in 2025, and at the start of 2025 there were 118,817 fewer residents aged 15 to 64 than in 2019. Statistics on unfilled posts do not show Croatia’s labour shortage. The number of imported workers and the demographics do. This matters for businesses because tax relief under the Investment Promotion Act requires three to fifteen new jobs, and some loans tie principal write-offs to hiring.
The analysis draws on Eurostat’s job vacancy statistics, the Croatian Ministry of the Interior’s statistics on residence and work permits, and data from the Croatian Pension Insurance Institute (HZMO), the Croatian Bureau of Statistics and Eurostat on population and employment. It shows where Croatia stands among member states, in which sectors workers are scarcest, how many workers are imported and what this means for projects tied to new jobs.
In brief
- Croatia’s job vacancy rate is 1.4% (first quarter of 2026), the EU’s 2.1% and the euro area’s 2.3%. The Netherlands (4.0%), Belgium (3.4%) and Malta (3.3%) have the highest rates, Romania (0.6%) and Poland (0.8%) the lowest.
- Croatia has been below the EU average in all 29 quarters since 2019. Its peak was 2.1% in the first quarter of 2022, when the EU stood at 3.0%.
- The most unfilled posts in Croatia are in health (2.8% at the end of 2025) and education (3.3%), and in season also in accommodation and food service (2.3%), while the business economy had 0.9% at the end of 2025.
- Residence and work permits rose from 66,655 in 2020 to 206,529 in 2024 and fell to 170,723 in 2025. Extensions made up 41.2% of permits in 2025, against 27.5% in 2024.
- Tourism and hospitality (52,858) and construction (52,776) account for 61.9% of the 2025 permits. Most went to citizens of Bosnia and Herzegovina, Nepal, Serbia, the Philippines and India.
- The employment rate (20 to 64) rose from 66.4% in 2019 to 74.4% in 2025, and HZMO had 1,729,787 insured persons at the end of 2025. Unemployment was 4.4% in June 2026, against 6.1% in the EU.
Sources: 12, listed at the end · How we check our information · Report an error
Key figures
The labour market in Croatia and the EU in mid-2026
Sources: Eurostat (jvs_q_nace2, demo_pjanbroad, lfsi_emp_a); Croatian Ministry of the Interior, residence and work permit statistics.
How many vacant posts are there in Croatia and the EU?
The job vacancy rate is the share of unfilled posts that an employer is actively trying to fill in the total of occupied and vacant posts. Eurostat publishes it quarterly. In the first quarter of 2026 Croatia had 1.4%, after 1.2% in the fourth quarter of 2025 and 1.6% a year earlier. The EU average was 2.1% and the euro area 2.3%. In industry and construction the EU had 1.8%, in services 2.3%.
The Netherlands (4.0%), Belgium (3.4%), Malta (3.3%) and Austria (3.1%) lead, followed by Cyprus (2.8%), Germany (2.7%) and Slovenia (2.5%). At the bottom are Romania (0.6%), Poland (0.8%) and Bulgaria, Spain and Slovakia (0.9% each). Among the 25 member states with comparable data Croatia ranks 18th, or eighth from the bottom. Only Romania, Poland, Bulgaria, Spain, Slovakia, Ireland (1.1%) and Luxembourg (1.3%) have a lower rate than Croatia. Hungary has 2.1% and Slovenia 2.5%.
Interactive chart
Job vacancy rate by EU member state, first quarter of 2026
Netherlands
Belgium
Malta
Austria
Cyprus
Germany
Slovenia
France*
Latvia
Lithuania
Denmark
Greece
Hungary
Sweden
EU-27 average
Finland
Italy*
Czechia
Portugal
Estonia
Croatia
Luxembourg
Ireland
Bulgaria
Spain
Slovakia
Poland
Romania
Share of vacant posts in all posts (vacant and occupied), whole economy excluding agriculture, not seasonally adjusted. With 1.4% Croatia is among the eight member states with the lowest rate. France and Italy (asterisk) do not survey public administration, so their data are not fully comparable.
Show the data in a table
| Country | Job vacancy rate |
|---|---|
| Netherlands | 4.0% |
| Belgium | 3.4% |
| Malta | 3.3% |
| Austria | 3.1% |
| Cyprus | 2.8% |
| Germany | 2.7% |
| Slovenia | 2.5% |
| France* | 2.4% |
| Latvia | 2.2% |
| Lithuania | 2.2% |
| Denmark | 2.1% |
| Greece | 2.1% |
| Hungary | 2.1% |
| Sweden | 2.1% |
| EU-27 average | 2.1% |
| Finland | 1.9% |
| Italy* | 1.9% |
| Czechia | 1.8% |
| Portugal | 1.6% |
| Estonia | 1.5% |
| Croatia | 1.4% |
| Luxembourg | 1.3% |
| Ireland | 1.1% |
| Bulgaria | 0.9% |
| Spain | 0.9% |
| Slovakia | 0.9% |
| Poland | 0.8% |
| Romania | 0.6% |
Source: Eurostat, euro indicators release on the job vacancy rate for the first quarter of 2026 (16 June 2026). Ranking: Omnia Solutions.
A low rate can mean one of two things, weak demand for labour or posts that are filled quickly. For Croatia the second applies. The number of occupied posts in sections B to S rose from 1,221,065 in the fourth quarter of 2019 to 1,368,385 in the fourth quarter of 2025, by 147,320 or 12.1%, and unemployment stood at 4.4% in June 2026. Employers do fill their posts, but increasingly with workers from abroad, as the Ministry of the Interior data below show.
How has the rate moved since 2019?
Croatia has been below the EU average in all 29 quarters since the start of 2019. The gap was widest in 2022, when the EU, after the pandemic, stood at 2.9% to 3.1% and Croatia at 1.2% to 2.1%. Croatia’s annual average was 1.5% in 2019, 1.1% in the pandemic year 2020, around 1.6% from 2021 to 2024 and 1.5% in 2025. The EU average ranged from 1.8% in 2020 to 3.0% in 2022 and fell to 2.1% in 2025. The gap is narrowing mainly because EU demand for labour is weakening.
Interactive chart
Job vacancy rate since 2019: Croatia, the EU and Slovenia
Show the data in a table
| Quarter | Croatia | EU-27 | Slovenia |
|---|---|---|---|
| Q1 2019 | 1.9% | 2.4% | 2.7% |
| Q2 2019 | 1.5% | 2.3% | 2.3% |
| Q3 2019 | 1.3% | 2.2% | 2.2% |
| Q4 2019 | 1.2% | 2.2% | 2.0% |
| Q1 2020 | 1.5% | 2.0% | 2.2% |
| Q2 2020 | 0.8% | 1.7% | 1.4% |
| Q3 2020 | 1.2% | 1.8% | 1.8% |
| Q4 2020 | 1.0% | 1.8% | 1.5% |
| Q1 2021 | 1.5% | 2.1% | 2.2% |
| Q2 2021 | 1.7% | 2.3% | 2.7% |
| Q3 2021 | 1.6% | 2.5% | 2.8% |
| Q4 2021 | 1.5% | 2.7% | 2.5% |
| Q1 2022 | 2.1% | 3.0% | 3.2% |
| Q2 2022 | 1.7% | 3.1% | 3.3% |
| Q3 2022 | 1.2% | 2.9% | 3.1% |
| Q4 2022 | 1.4% | 2.9% | 2.5% |
| Q1 2023 | 2.0% | 3.0% | 3.0% |
| Q2 2023 | 1.6% | 2.9% | 2.9% |
| Q3 2023 | 1.6% | 2.7% | 2.7% |
| Q4 2023 | 1.3% | 2.6% | 2.2% |
| Q1 2024 | 1.9% | 2.6% | 2.5% |
| Q2 2024 | 1.7% | 2.4% | 2.5% |
| Q3 2024 | 1.5% | 2.3% | 2.4% |
| Q4 2024 | 1.4% | 2.3% | 2.0% |
| Q1 2025 | 1.7% | 2.2% | 2.3% |
| Q2 2025 | 1.5% | 2.1% | 2.2% |
| Q3 2025 | 1.5% | 2.0% | 2.2% |
| Q4 2025 | 1.2% | 2.0% | 2.0% |
| Q1 2026 | 1.4% | 2.1% | 2.5% |
Quarterly data, not seasonally adjusted, all enterprise sizes. Up to the end of 2025 the coverage is NACE Rev. 2 sections B to S; for the first quarter of 2026 it is NACE Rev. 2.1 sections B to T, so the last point is taken from the news release. Hover over or tap the chart.
Source: Eurostat, dataset jvs_q_nace2 (as of 20 March 2026) and news release of 16 June 2026.
Croatia’s rate is regularly highest in the first quarter, when posts for the tourist season are being filled, and lowest in the fourth. In 2025 the number of vacant posts fell from 22,176 to 17,253. Slovenia, with a similar demographic picture, stays at the EU average.
Where in Croatia are workers scarcest?
The sector data change the usual picture. In the business economy, that is industry, construction and market services, the rate was 0.9% in the fourth quarter of 2025 and 1.3% in the second quarter. Manufacturing had 1.0% and 1.3%, construction 1.2% and 1.7%, and information and communication only 0.3%. The highest rates are in health and social work (3.4% in season, 2.8% at the end of the year) and in education (3.3% in the fourth quarter). In accommodation and food service the rate reaches 2.3% in the second quarter and falls to 1.5% out of season.
Interactive chart
Where Croatia lacks workers: vacancy rate by sector in 2025
Total (B–S)
Business economy (B–N)
Manufacturing
Construction
Accommodation and food service
Information and communication
Administrative and support services
Education
Health and social work
Total (B–S)
Business economy (B–N)
Manufacturing
Construction
Accommodation and food service
Information and communication
Administrative and support services
Education
Health and social work
In the season the most unfilled posts are in health (3.4%), accommodation and food service and administrative services (2.3% each). The business economy as a whole has 1.3%.
Source: Eurostat, jvs_q_nace2, Croatia by NACE Rev. 2 section, all enterprise sizes, not seasonally adjusted.
Tellingly, health and education, the sectors with the highest rates, are not among the five with the most permits for foreign workers. Construction, tourism, industry, transport and trade largely compensate for shortages by importing workers, which is the likely reason for their lower rates out of season. Health and education use that route less, so their unfilled posts remain visible.
How many workers does Croatia import?
After the Aliens Act abolished quotas from 1 January 2021, the number of residence and work permits rose every year. 66,655 were issued in 2020, 81,995 in 2021, 124,121 in 2022, 172,499 in 2023 and 206,529 in 2024, 3.1 times the 2020 figure. In 2025 170,723 permits were issued, 35,806 or 17.3% fewer than a year earlier. In the first six months of 2026 the figure was 94,113.
In 2024 new permits made up 64.0% and extensions 27.5%. In 2025 there were 80,365 new permits (47.1%), 70,275 extensions (41.2%) and 20,083 seasonal permits. The likely explanation is the amendment that extended the validity of permits from one year to up to three, so part of the workforce no longer enters the statistics every year. The number of permits should therefore not be equated with the number of foreign workers. In February 2025 the Government stated that 113,504 foreign workers held a valid permit, which is 6.6% of the number of HZMO insured persons at the end of 2024.
Interactive chart
Residence and work permits issued to foreigners in Croatia
2020
2021
2022
2023
2024
2025
Jan to Jun 2026
2023
2024
2025
Jan to Jun 2026
Tourism and hospitality
Construction
Industry
Transport and communications
Trade
Bosnia and Herzegovina
Nepal
Serbia
Philippines
India
North Macedonia
Kosovo
Uzbekistan
Egypt
Bangladesh
Number of permits issued, not the number of foreign workers, because one person can receive several permits in a year. The peak was 2024 with 206,529 permits; 170,723 were issued in 2025.
Source: Croatian Ministry of the Interior, monthly statistics on residence and work permits (December 2024, December 2025, June 2026); Government of Croatia, presentation of amendments to the Aliens Act (February 2025).
Tourism and hospitality received 52,858 permits in 2025, construction 52,776, industry 24,479, transport and communications 13,039 and trade 8,601. The most permits went to citizens of Bosnia and Herzegovina (32,225), Nepal (31,708), Serbia (24,278), the Philippines (17,629) and India (15,400). The ten most common nationalities account for 90.1% of all permits.
Across the EU, non-EU citizens made up 6.4% of employed people aged 20 to 64 in 2025, against 4.5% in 2019. For Croatia the Labour Force Survey reports unreliably low numbers of foreign workers, so permit statistics are the relevant measure.
Why does the shortage persist despite record employment?
The answer lies in demographics. There were 2,557,506 residents aged 15 to 64 at the start of 2019 and 2,438,689 at the start of 2025, 118,817 or 4.6% fewer. The number of people over 65 rose by 66,333 in the same period. Since 2023 the working-age population has been growing slightly again, by 12,296 in two years, consistent with immigration. The domestic labour reserve is being used up at the same time. The employment rate (20 to 64) rose from 66.4% in 2019 to 74.4% in 2025, eight percentage points, while in the EU it rose by 3.4 points to 76.1%.
HZMO had 1,729,787 insured persons at the end of 2025, 20,915 more than a year earlier, and the ratio of insured persons to pensioners improved to 1.41 to 1. According to the Labour Force Survey there were 1,706 thousand employed people in the first quarter of 2026, 19 thousand more than a year earlier, with an unemployment rate of 5.6%. Eurostat’s seasonally adjusted unemployment rate stood at 4.4% in June 2026, against 6.1% in the EU. Every new job in Croatia is therefore increasingly filled by a worker from abroad or by taking a worker from another employer.
What this means for businesses
- Tax relief under the Investment Promotion Act requires an investment of at least EUR 150,000 with five new jobs, EUR 50,000 with three for micro enterprises, and ten or fifteen jobs for investments above EUR 1 million or EUR 3 million. Each job must be kept for three years from the date it is filled, five years for large enterprises, and with a tax relief for no less than the period in which the relief is used. Hiring must therefore be planned before the application, including the lead time for permits if foreign workers are needed. The effect of the relief on a specific investment can be checked in the investment incentives calculator.
- The same act also gives a grant for every new job, depending on the county unemployment rate. In counties with unemployment up to 5% it is up to 10% of wage costs, at most EUR 5,000 per job, and between 5% and 10% up to 20%, at most EUR 10,000. Which counties fall into which group is shown in our article on regional disparities by county.
- Manufacturing companies that cannot hire can also obtain the relief for a modernisation investment of at least EUR 500,000, provided the number of employees does not fall. For companies short of workers this is often a more realistic route than expansion.
- The HAMAG-BICRO micro loan for growth and inclusion offers a write-off of up to 30% of the principal for timely repayment and the hiring of a person from a target group, on a permanent full-time contract kept for at least 12 months. The conditions for all loans are in our guide to HAMAG-BICRO loans 2026, and programmes for start-ups in the guide for young people, women and new entrepreneurs.
- In the Integrator call every consortium member must have at least one employee, and the value-for-money criterion carries 26 of 100 points. Submissions were temporarily suspended on 3 July 2026. We keep an overview of open calls in our guide to business incentives in Croatia 2026.
Methodology: the job vacancy rate for the first quarter of 2026 comes from Eurostat’s news release of 16 June 2026 (whole economy, NACE Rev. 2.1 sections B to T, not seasonally adjusted), while the series from 2019 to 2025 and the sector data come from the dataset jvs_q_nace2 (NACE Rev. 2 sections B to S, database as of 20 March 2026). Because of the change in classification, individual quarters differ by 0.1 to 0.2 points between the two sources. France and Italy do not survey public administration and are marked with an asterisk in the ranking. Residence and work permits are taken from the Ministry of the Interior’s monthly statistics (2023 to June 2026) and from the Government’s presentation of the amendments to the Aliens Act (2020 to 2022), with the ratios checked against the bill of October 2024. Population is as of 1 January (Eurostat, demo_pjanbroad), the employment rate is for ages 20 to 64 (lfsi_emp_a) and unemployment is the seasonally adjusted monthly rate (une_rt_m). All percentages and differences were calculated from the source values.
Frequently asked questions
What is the job vacancy rate in Croatia?
In the first quarter of 2026 it was 1.4%, against 2.1% in the EU and 2.3% in the euro area. Croatia is among the eight member states with the lowest rate and has been below the EU average in every quarter since 2019.
Does a low rate mean Croatia has no labour shortage?
No. The rate measures posts that remain unfilled, and Croatian employers fill them quickly with workers from abroad. The number of occupied posts has grown by 12.1% since the end of 2019, unemployment is 4.4%, and the working-age population is 118,817 smaller than in 2019.
How many permits for foreign workers has Croatia issued?
206,529 residence and work permits were issued in 2024, the most ever, and 170,723 in 2025, 17.3% fewer. In the first six months of 2026 the figure was 94,113. The drop in 2025 is probably linked to the extension of permit validity to up to three years, which raised the share of extensions to 41.2%.
Where do foreign workers come from and in which sectors do they work?
In 2025 the most permits went to citizens of Bosnia and Herzegovina (32,225), Nepal (31,708), Serbia (24,278), the Philippines (17,629) and India (15,400). Tourism and hospitality together with construction account for 61.9% of permits, followed by industry, transport and trade.
How many new jobs does the Investment Promotion Act require?
At least five with an investment of EUR 150,000, three for micro enterprises with EUR 50,000, ten for investments between EUR 1 million and EUR 3 million and fifteen above EUR 3 million. Jobs must be kept for three years, five for large enterprises, and with a tax relief for no less than the period in which the relief is used. Manufacturing companies can also obtain the relief for a modernisation investment of EUR 500,000 without new jobs if headcount does not fall.
How does the labour shortage affect a project application?
A project that promises new jobs needs a realistic hiring plan, including the lead time for permits for foreign workers, because the obligation is checked for years after the investment. Where hiring is unlikely, it is better to choose programmes that reward modernisation and productivity.

About the author
Davor Nikolić, MSc in Political Science
Co-founder and director of Omnia Solutions. He prepares and implements projects co-financed by EU and national funds, mainly in innovation, entrepreneurship and industry. From 2012 to 2014 he was an advisor in the Cabinet of the Minister of Entrepreneurship and Crafts, and from 2014 to 2018 a senior expert advisor for the implementation, evaluation and contracting of EU business projects at the Ministry of Economy, Entrepreneurship and Crafts. As a project manager, he has worked on the preparation and implementation of European and international projects with a total value of more than EUR 60 million. Since 2025 he has been an external member of the European Affairs Committee of the Croatian Parliament. He is a doctoral candidate in International Relations at the Faculty of Social Sciences, University of Ljubljana.
Sources
- Eurostat, Euro area job vacancy rate at 2.3%, news release for the first quarter of 2026 (16 June 2026)
- Eurostat, dataset jvs_q_nace2, job vacancy rate by quarter
- Croatian Ministry of the Interior, monthly statistics, December 2025 (residence and work permits 1 January to 31 December 2025, in Croatian)
- Croatian Ministry of the Interior, monthly statistics, June 2026 (in Croatian)
- Croatian Ministry of the Interior, statistics 2023, residence and work permits (in Croatian)
- Government of the Republic of Croatia, amendments to the Aliens Act, presentation (February 2025, in Croatian)
- Croatian Parliament, bill amending the Aliens Act, PZE 63 (October 2024, in Croatian)
- HZMO, annual report for 2025 (June 2026, in Croatian)
- Croatian Bureau of Statistics, Labour Force Survey, first quarter of 2026 (10 June 2026, in Croatian)
- Eurostat, demo_pjanbroad, population by broad age group
- Eurostat, lfsi_emp_a, employment rate 20 to 64
- Eurostat, lfsa_egan, employment by citizenship, EU-27
Planning an investment with new jobs?
Let us check which programme fits your hiring plan
We will review the investment, the job requirements under the Investment Promotion Act, HAMAG-BICRO and EU calls, and a realistic hiring timeline, and propose the most favourable combination. The introductory call is free.